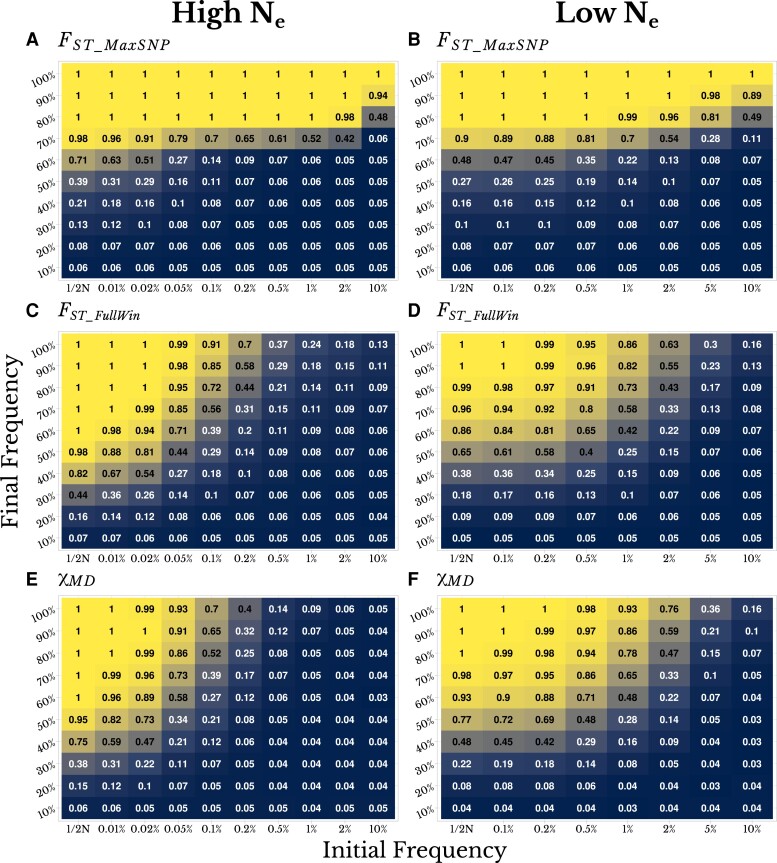
Fig. 1.
SNP-level FST and full-window statistics show complementary power to detect local adaptation, depending on the type of selective sweep simulated. Numbers and colors in each panel both depict statistical power to detect local adaptation, in high Ne populations (s = 0.001, left column) and low Ne populations (s = 0.01, right column). In each panel, the x-axis illustrates the pre-selection frequency of a favored variant (with the left column indicating selection on newly occurring mutations) and the y-axis illustrates the final frequency of the sweep (with the top row showing complete sweeps). Detection power is shown for (A and D) FST_MaxSNP, (B and E) FST_FullWin, and (C and F) χMD. These results are based on a demographic history of simple isolation between two populations without change in population size, with a split time of 0.2Ne generations.

