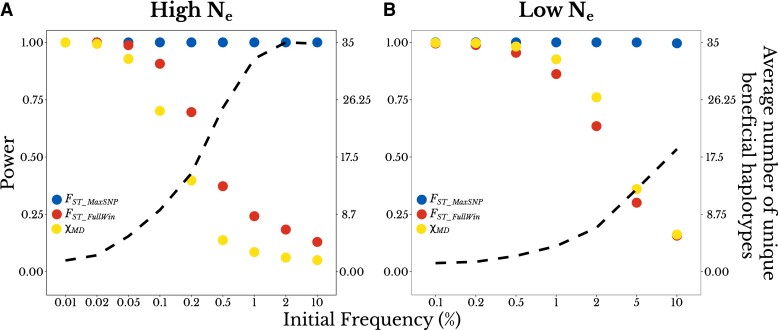
Fig. 2.
FST_MaxSNP shows an increasing power advantage as sweeps become softer. For complete sweeps with a range of initial frequencies (x-axis), the two y-axes show detection power for each statistic (left axis, dots) and the average number of unique beneficial haplotypes present at the end of the simulation (right axis, dashed line). Results are shown for (A) high Ne populations (s = 0.001) and (B) low Ne populations (s = 0.01), for the same demographic history as in fig. 1.

