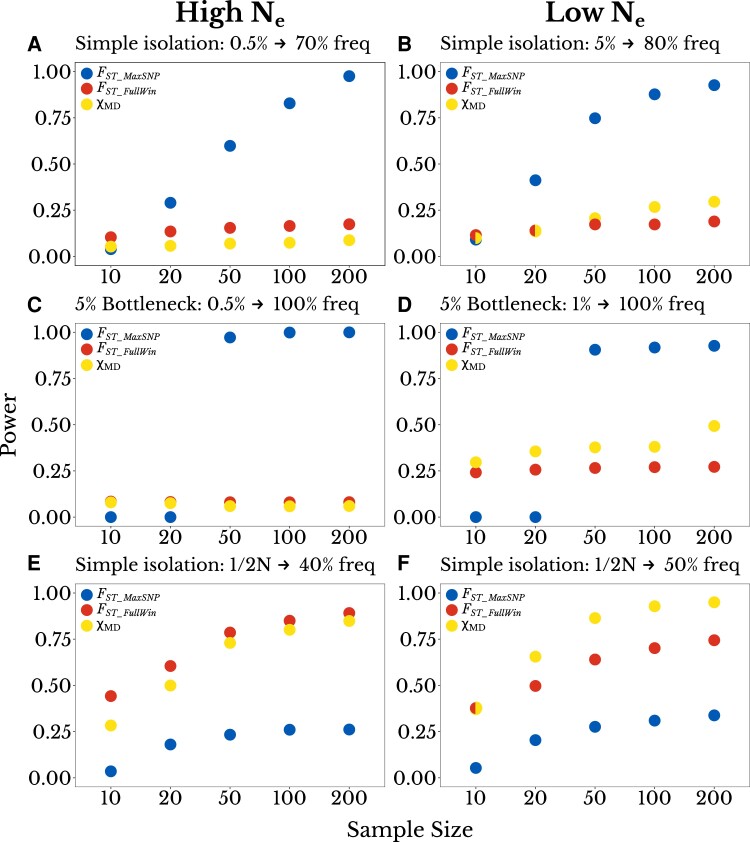
Fig. 3.
The power of FST_MaxSNP is particularly sensitive to sample size. Here, the power of each statistic (y-axis) is plotted as a function of sample size (x-axis; number of chromosomes per population). We found that depending on sample size, FST_MaxSNP outperforms FST_FullWinand χMD for a simple isolation model, for: (A) a high Ne population with initial beneficial allele frequency of 0.005 and final frequency of 0.70, and (B) a low Ne population with initial frequency of 0.05 and final frequency of 0.80. Similar results were observed for a complete soft sweep with a population bottleneck of 0.05, except that the loss of power for FST_MaxSNP was more immediate at lower sample sizes, for: (C) a high Ne population with initial frequency of 0.05, (D) a low Ne population with initial frequency of 0.01. For partial hard sweep scenarios where FST_FullWin and χMD outperform FST_MaxSNP, all three statistics show more gradual sample size effects, specifically for new mutations and: (E) a final frequency of 0.40 in a high Ne population, and (F) a final frequency of 0.50 in a low Ne population.

