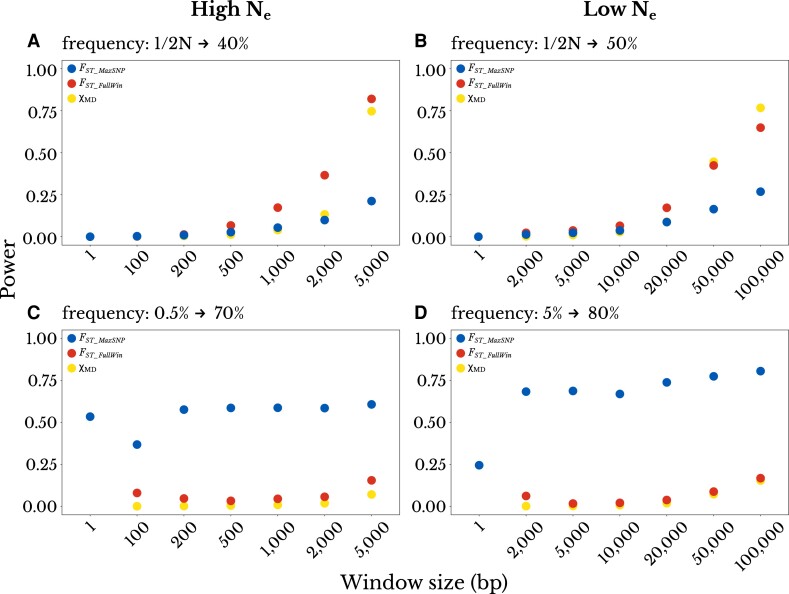
Fig. 4.
Varying window size does not reveal a single statistic with broad detection power. The top panels show partial hard sweeps for which FST_FullWinand χMD outperform FST_MaxSNP: (A) a high Ne population with a final beneficial allele frequency of 0.40, and (B) a low Ne population with a final frequency of 0.50. The bottom panels show mostly complete soft sweeps for which FST_MaxSNPoutperforms FST_FullWin and χMD: (C) a high Ne population with an initial beneficial allele frequency of 0.005 and final frequency of 0.70, and (D) a low Ne population with initial frequency of 0.05 and final frequency of 0.80. These power values reflect a Bonferroni-corrected significance threshold to reflect the relatively larger number of smaller windows needed. Results do not suggest that any statistic in a smaller window size captures the advantages of both FST_MaxSNP and the full-window statistics.

