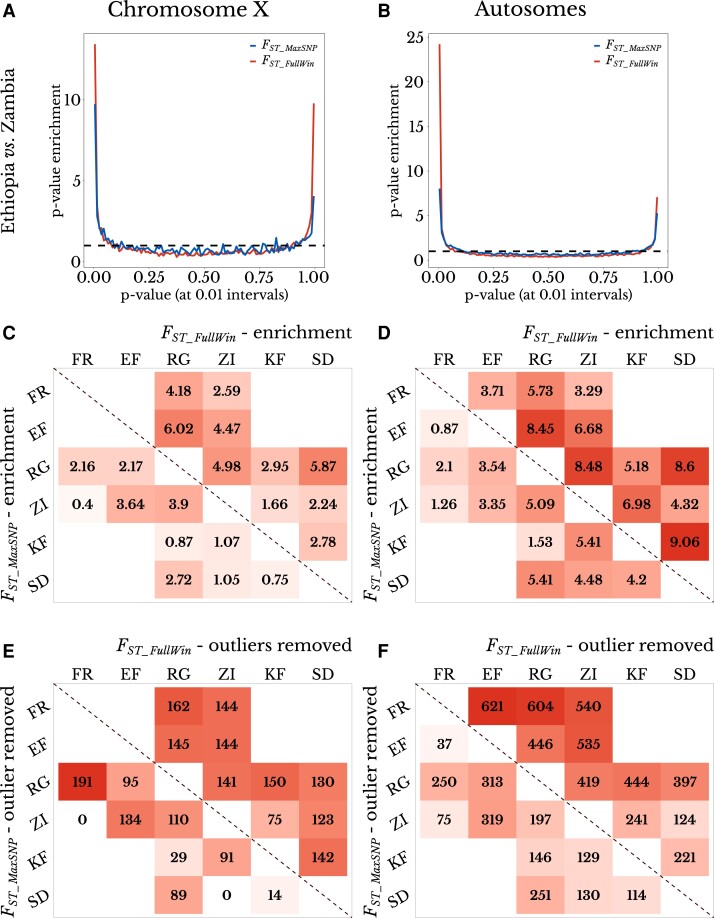
Fig. 5.
FST_MaxSNP and FST_FullWin both show outlier enrichment between natural populations of D. melanogaster. (A and B) Ethiopia–Zambia FST_MaxSNP and FST_FullWin values on (A) chromosome X and (B) autosomes show enrichment of low (right) and especially high values (left), based on the distribution of P-values obtained from neutral demographic simulations. (C and D) FST_MaxSNP (lower diagonal) and FST_FullWin (upper diagonal) both show enrichment of high outliers on (C) chromosome X and (D) combined autosome arms. FST_FullWin shows a greater enrichment in nearly all cases. (E and F) The number of outlier regions that were removed to erase the signature of enrichment for high FST_MaxSNP (lower diagonal) and FST_FullWin (upper diagonal) for each population on (E) chromosome X and (F) the combined autosome arms. FST_FullWin was associated with a greater outlier region enrichment for most population pairs, reinforcing the window-level patterns shown in (C) and (D). Populations: SD, South Africa; ZI, Zambia; KF, Kafue; RG, Rwanda; EF, Ethiopia. Population pairs that were not present in the same demographic model were not evaluated. Color scale ranges from the minimum to maximum value within each panel.

