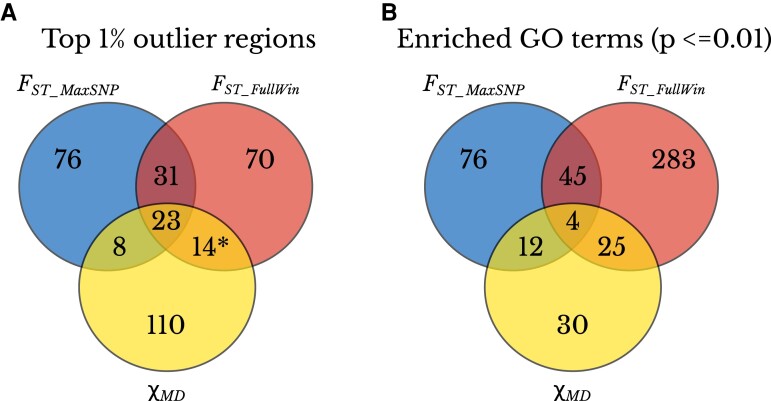
Fig. 6.
The three statistics detect mostly unique genomic regions and functional categories. (A) Overlap between the top 1% outlier regions detected with FST_MaxSNP, FST_FullWin, and χMD. * indicates the average number of outlier regions between the two statistics: 15 FST_FullWin outlier regions exclusively overlap χMD outliers and 13 χMD outlier regions exclusively overlap FST_FullWin outliers. (B) Overlap between enriched GO terms with raw P-value <= 0.01, out of a total of 47,496 GO terms, based on the outlier regions detected with FST_MaxSNP, FST_FullWin, and χMD.

