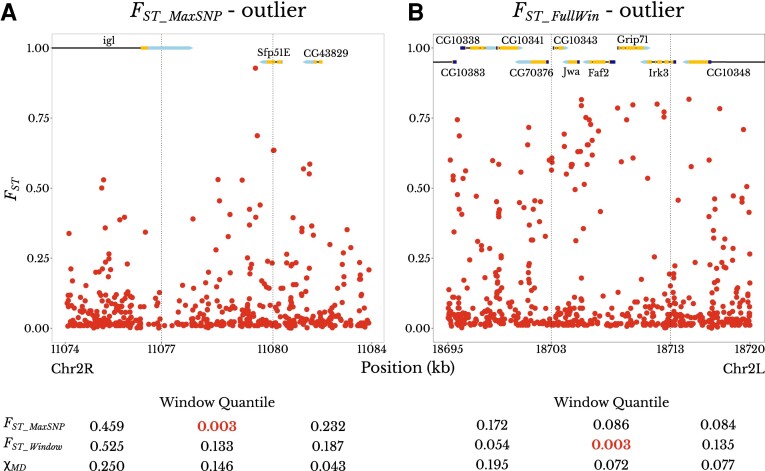
Fig. 7.
Examples of the distinct SNP-level FST landscapes associated with FST_MaxSNP versus FST_FullWin outliers. Each plot shows an outlier window for an Ethiopia–Zambia FST statistic, plus its adjacent windows. Dashed vertical lines delimit the boundaries of the windows. Numbers under each window are the empirical quantiles of that window's statistic (FST_MaxSNP, FST_FullWin, and χMD) in relation to the chromosome arm-wide distribution of the same statistic, with the outlier (quantile < 0.01) value in red. (A) An outlier window for FST_MaxSNP (center) shows a peak-like FST landscape with one particularly differentiated SNP. (B) An outlier window for FST_FullWin (center) shows a broad plateau of fairly high FST values. Gene names and structures are shown at the top of each plot. Protein-coding exons are in yellow, while 5′ and 3′ untranslated regions are in dark blue and light blue, respectively.

