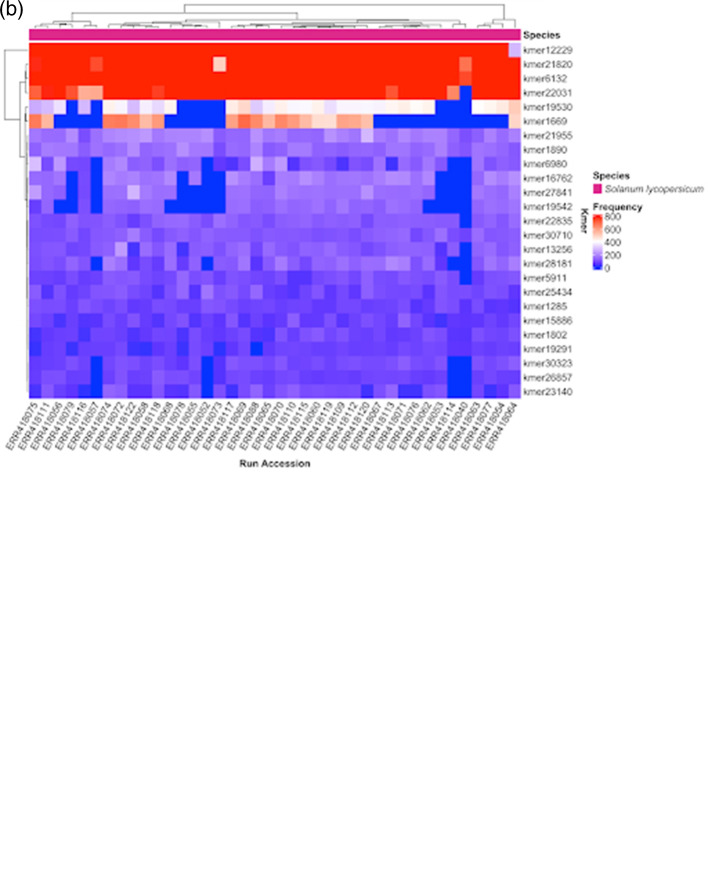
Figure 2. (a). kTom workflow, with major steps for individual sample and population data processing. (uniq = get unique reads; dedup = deduplicate reads). (b). k-mer frequency heatmap from kTom.
Frequency of selected k-mers in each accession analyzed. Differential k-mer frequencies are apparent in this view. Depending on the nature of the accessions, this view may provide a first glimpse into genetic sequences underlying structural variations that differentiate the accessions.

