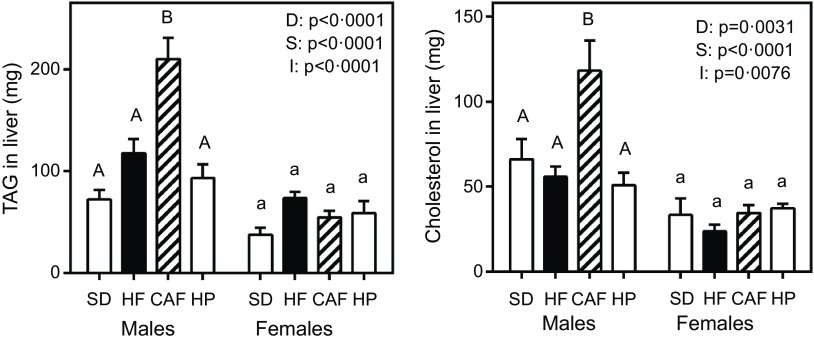
Fig. 1.
TAG and cholesterol liver content. Data are the mean with their standard error of the mean of six to eight animals per group. White bars: standard diet (SD); black bars: high-fat diet (HF); dashed bars: cafeteria diet (CAF) and lattice bars: high-protein diet (HP). Statistical differences between groups: two-way ANOVA (D, diet; S, sex; I, their interaction). Bonferroni’s post hoc test: different letters represent statistically significant differences between groups of the same sex.

