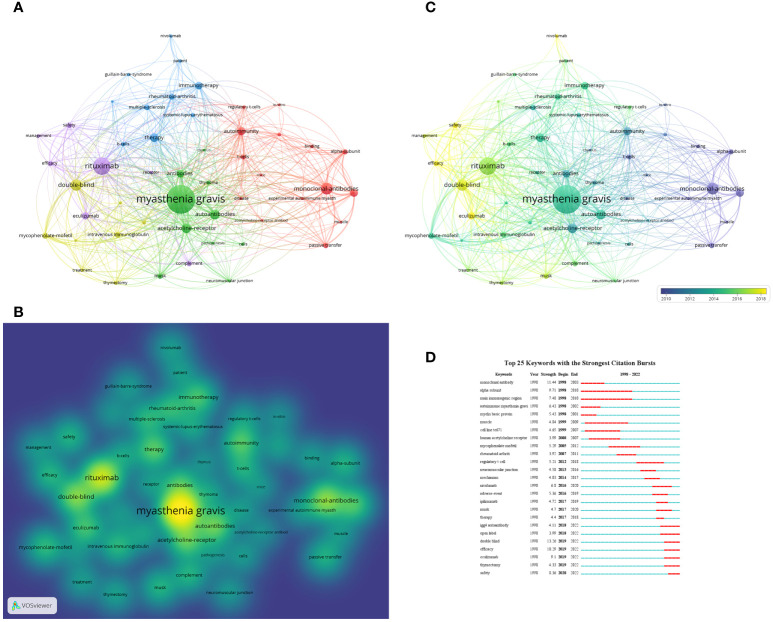
Figure 9.
(A) Network visualization of keywords based on VOSviewer. In this network map, keywords with close relationship are assigned to one cluster with the same color. All the keywords could be divided into five clusters: cluster 1 (red nodes), cluster 2 (green nodes), cluster 3 (blue nodes), cluster 4 (yellow nodes) and cluster 5 (purple nodes). (B) Density visualization of keywords based on VOSviewer. (C) Overlay visualization of keywords based on VOSviewer. The nodes marked with purple or blue color represent the keywords that appeared relatively earlier, whereas keywords coded with yellow color represents the current research focuses. (D) The top 25 keywords with the strong citation bursts in articles related to targeted immunotherapy for MG.

