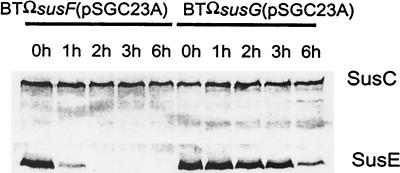
FIG. 8.
Immunoblots showing changes in proteolytic sensitivity of SusC and SusE in two strains, BTΩsusF(pSGC23A) and BTΩsusG(pSGC23A). Strain BTΩsusF(pSGC23A) does not produce SusF; strain BTΩsusG(pSGC23A) produces SusF. Portions of cell extracts (100 μg of protein) were loaded onto each lane. Conditions were the same as those used for Fig. 4. The protein detected on each immunoblot is given to the right of the panel. Lanes are labeled according to the sampling time after addition of proteinase K. Note that these digestion times are shorter than those in Fig. 4, so that digestion of SusC is not detected.

