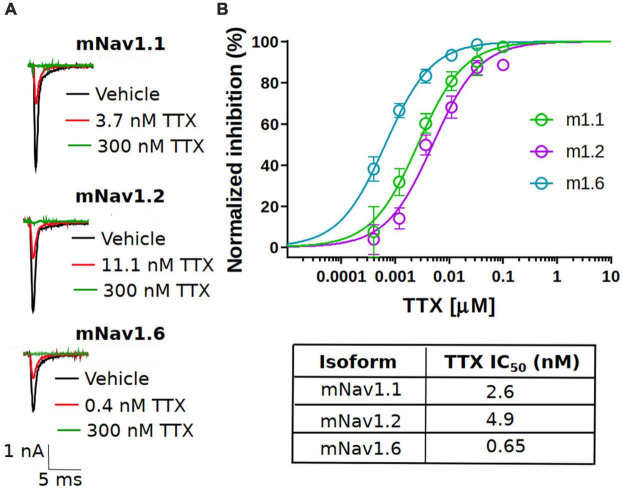
FIGURE 1.
Potency of TTX inhibition on the mouse neuronal Nav channels. (A) Representative traces of voltage-clamp recordings of vehicle (black) and the concentration close to the TTX IC50 (red) for mouse Nav channel isoforms (mNav1.1, mNav1.2 and mNav1.6) heterologously expressed in HEK293 cells. For all the tested Nav channel isoforms, 300 nM TTX (green trace) showed complete block of Na+-current. (B) Concentration-response relationship for TTX inhibition of mouse Nav1.1, Nav1.2 and Nav1.6 channel isoforms. Each concentration represents the mean of n = 7–15 cells. The solid line is the best fit of the average data to the Hill equation yielding IC50 = 2.6 nM for mNav1.1, 4.9 nM for mNav1.2 and 0.65 nM for mNav1.6.

