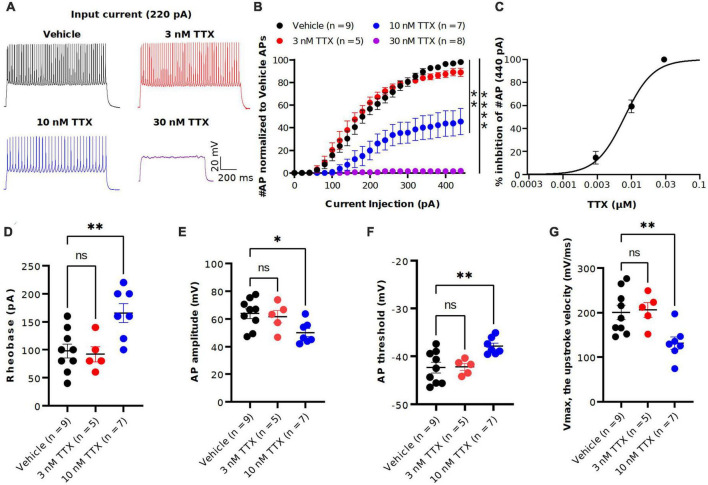
FIGURE 3.
TTX suppression of intrinsic excitability in cortical pyramidal neurons. (A) Representative voltage traces recorded from a cortical pyramidal neuron at a current injection of 220 pA in vehicle (black) and in presence of TTX at concentraions of 3 (red), 10 (blue) and 30 nM (magenta). (B) Mean data of number of APs as a function of various current injection for pyramidal neurons with and without TTX application. Significant differences in the AP number between the vehicle and TTX treated (30 and 100 nM) was seen (two-way ANOVA, *p < 0.05, **p < 0.01, ****p < 0.0001). (C) Concentration-response relationship for TTX inhibition of AP firing at a current injection of 440 pA. Each concentration represents the mean of n = 5–9 neurons. The solid line is the best fit of the average data to the Hill equation yielding IC50 = 7.9 nM. (D–G) Scatter plots showing the AP properties of pyramidal neurons include rheobase (D) AP amplitude (E), AP threshold (F) and upstroke velocity (G). 10 nM TTX significantly increased rheobase and AP threshold whereas AP amplitude and upstroke velocity was significantly decreased (one-way ANOVA, *p < 0.05, **p < 0.01).

