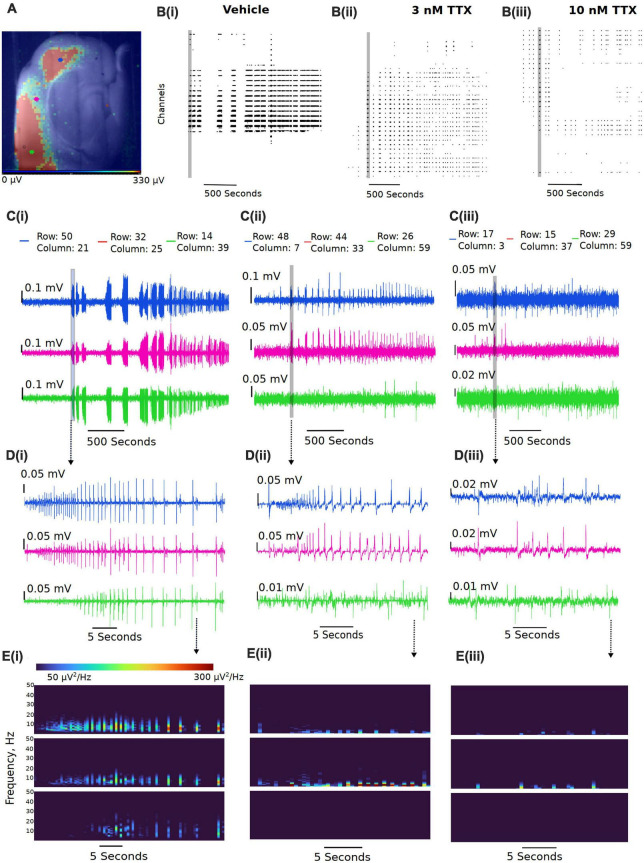
FIGURE 5.
Representative reduction in seizure-like events following sodium current block by TTX. (A) Example slice from a multi-electrode array recording during a seizure-like event. Colored dots (blue, pink, and green dots) represent the approximate location of the selected traces. (B) Example raster plots from the entire recordings for the (Bi) 0 Mg2+ vehicle, the (Bii) 3 nM TTX, and the (Biii) 10 nM TTX. (C) Example traces taken from either end of the neocortical slice (blue and green traces) and a trace selected from the middle of the slice (pink trace) for the (Ci) 0 Mg2+ vehicle, the (Cii) 3 nM TTX, and the (Ciii) 10 nM TTX. (D) Zoomed in view of the first seizure-like events from each of the three treatment groups. (E) Spectral plots of the zoomed in seizure-like events in μV2.

