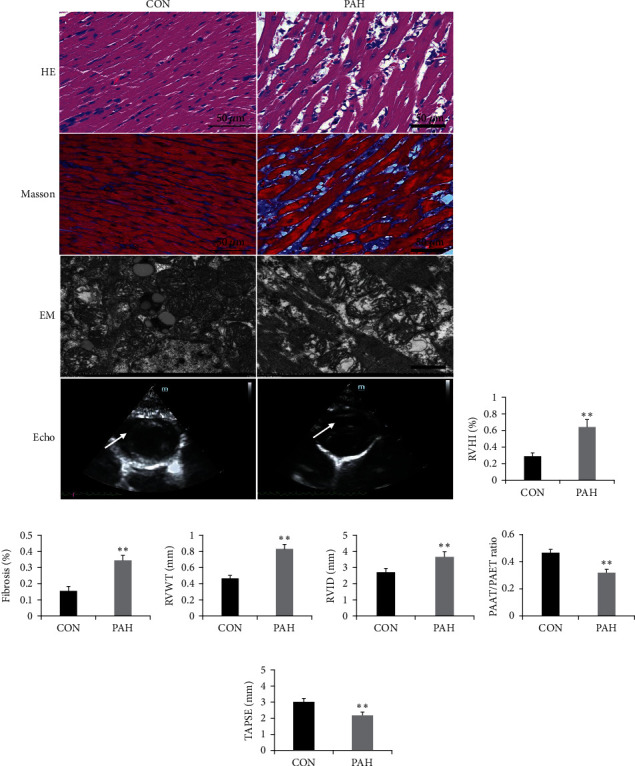
Figure 1.

Right ventricle remodeling in MCT-induced PAH. (a) Representative images of HE, Masson staining, electron microscopy, and echocardiography in right ventricle of PAH rats; scale bars indicate 50 μm or 10 μm; (b) RVHI changes after MCT injection; (c) fibrosis changes after MCT injection; (d) RVWT changes after MCT injection; (e) RVID changes after MCT injection; (f) PAAT/PAET ratio changes after MCT injection; and (g) TAPSE changes after MCT injection. Arrow indicates right ventricular hypertrophy and mitochondrial swelling in PAH group. EM: electron microscopy; RVHI: right ventricular internal diameter; RVWT: right ventricular wall thickness; RVID: right ventricular internal diameter; TAPSE: tricuspid annular plane systolic excursion; PAAT: pulmonary artery acceleration time; PAET: pulmonary artery ejection time; mPAP: mean pulmonary arterial pressure. Data are presented as mean ± SD; n = 8 per group; ∗P < 0.05 and ∗∗P < 0.01.
