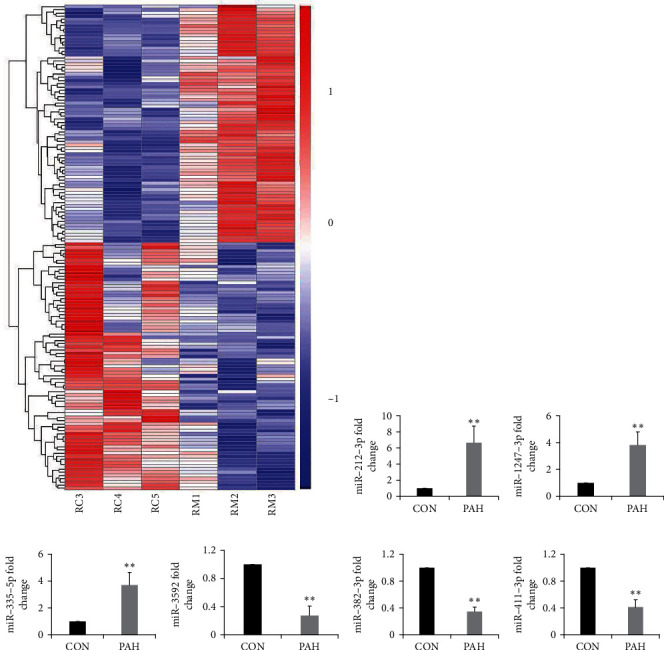
Figure 2.

High-throughput RNA sequencing. (a) The distributions of the total expression of the miRNAs in six samples (n = 3 per group). (b-g) RT-qPCR validation of six dysregulated miRNAs in PAH rats compared with the controls. Data are presented as mean ± SD; n = 4 per group; ∗P < 0.05 and ∗∗P < 0.01.
