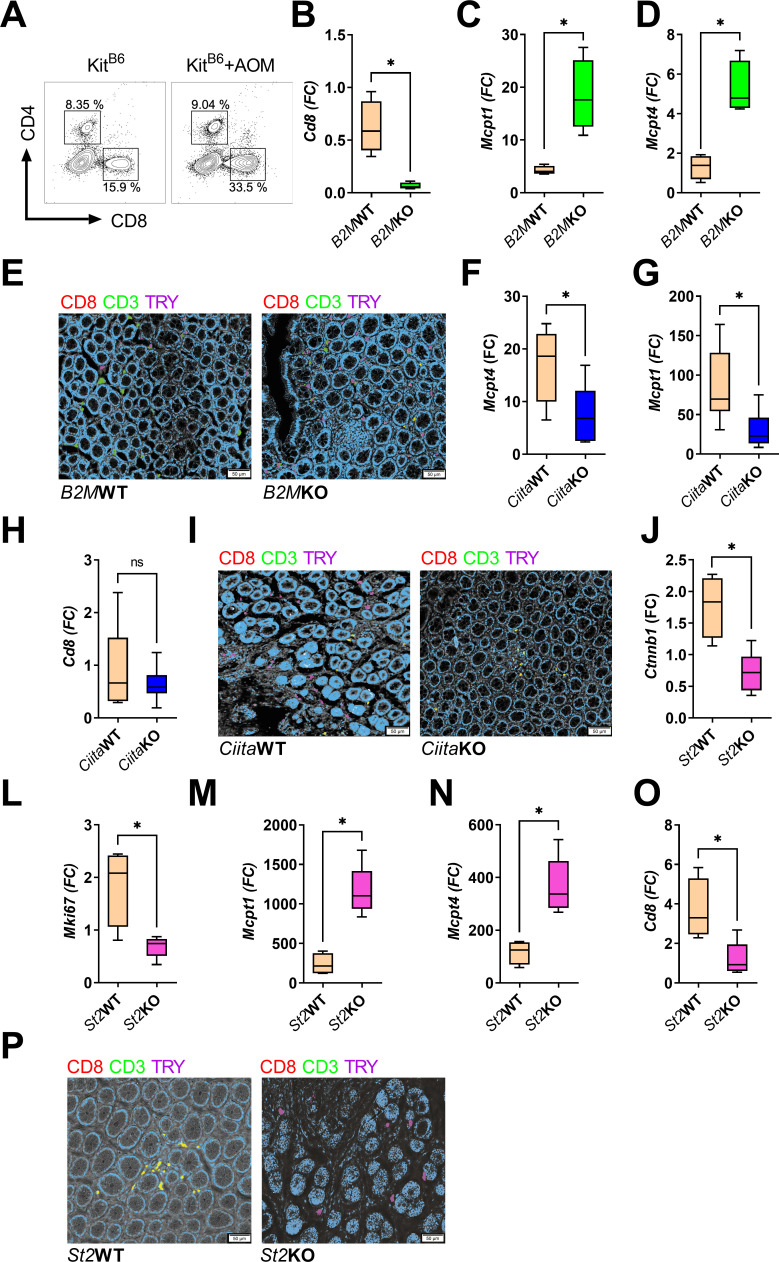
Figure 4.
The early colorectal tumorigenic steps require complex immune reactions to develop. (A) Representative dot plot graphs of CD4+ and CD8+ lymphocytes gated for CD45+, live cells, and singlet. (B–D, F, G, J–O) Gene expression analysis for Cd8 (B, n=8, *p=0.02; H, n=13, p>0.05; O, n=9, *p=0.03), Mcpt1 (C, n=8, *p=0.02; G, n=13, *p=0.02; M, n=9, *p=0.01), Mcpt4 (D, n=8, *p=0.02; F, n=13, *p=0.02; N, n=9, *p=0.01), Ctnnb1 (J, n=9, *p=0.03), and Mki67 (L, *p=0.03) in B2MKO, CiitaKO, and St2KO mice, and their counterparts. (E, I, P) Representative images of multiplex IHC staining with anti-CD8, anti-CD3, and anti-TRY antibodies (magnification at 50 µm). Data are shown as the median, highest and lowest values, and upper and lower quartiles. P values were calculated using a two-tailed Mann-Whitney’s U test. IHC, immunohistochemistry.

