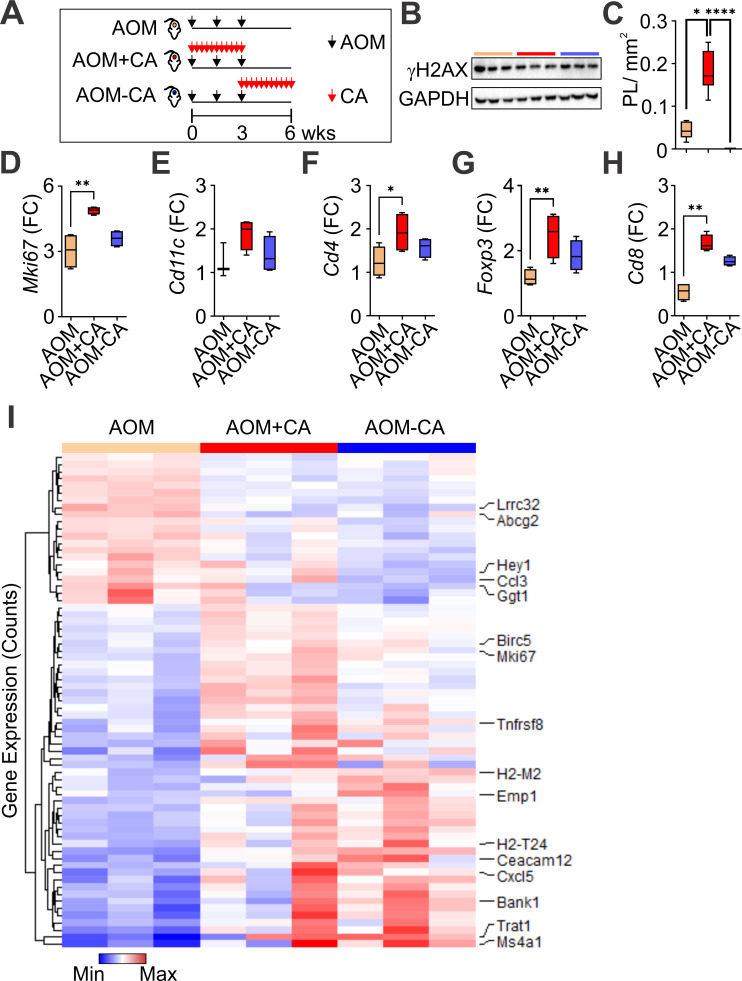
Figure 6.
The MC activity impacts the development of early tumorigenic lesions in the colon. (A) Timeline for different groups treated with CA (red arrows) and AOM (black arrows) throughout 6 weeks. (B) DNA damage levels by immunoblotting against γH2AX and GADPH in colon samples. (C) Inhibiting MC activity in specific timepoints of carcinogenic exposure can either promote or inhibit the development early tumorigenic events in the colon (n=24; *p=0.042, ****p<0.0001). (D–H) Gene expression analysis for Mki67 (n=24; *p<0.01; AOM vs AOM+CA), Cd11c (p>0.05), Cd4 (*p<0.05; AOM vs AOM+CA), Foxp3 (*p<0.01; AOM vs AOM+CA), and Cd8 (*p<0.01; AOM vs AOM+CA). Data are shown as the median, highest and lowest values, and upper and lower quartiles (C–H). P values were calculated using ANOVA with a Kruskal-Wallis' post hoc test. (I) Heatmap of hierarchical clustering obtained from RNA-seq data indicates differentially expressed genes (n=12). ANOVA, analysis of variance; AOM, azoxymethane; CA, colitis-associated; MC, mast cell.

