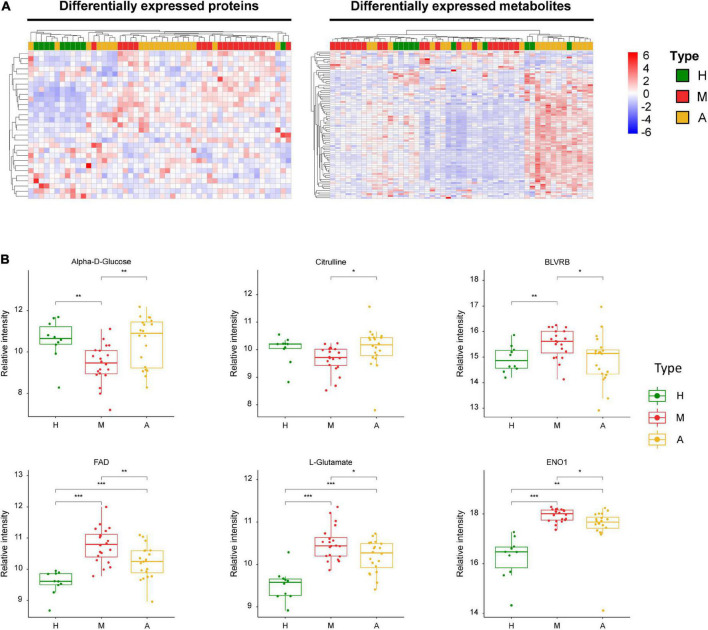
FIGURE 5.
Dysregulated proteins and metabolites between M group and A group. (A) Heatmap of DEPs and DEMs between M group and A group. (B) The expression level change of the key proteins and metabolites with significant difference between M group and A group. Asterisks indicate statistical significance based on unpaired two-sided Welch’s t-test. Significance levels: *P < 0.05, **P < 0.01, ***P < 0.001.

