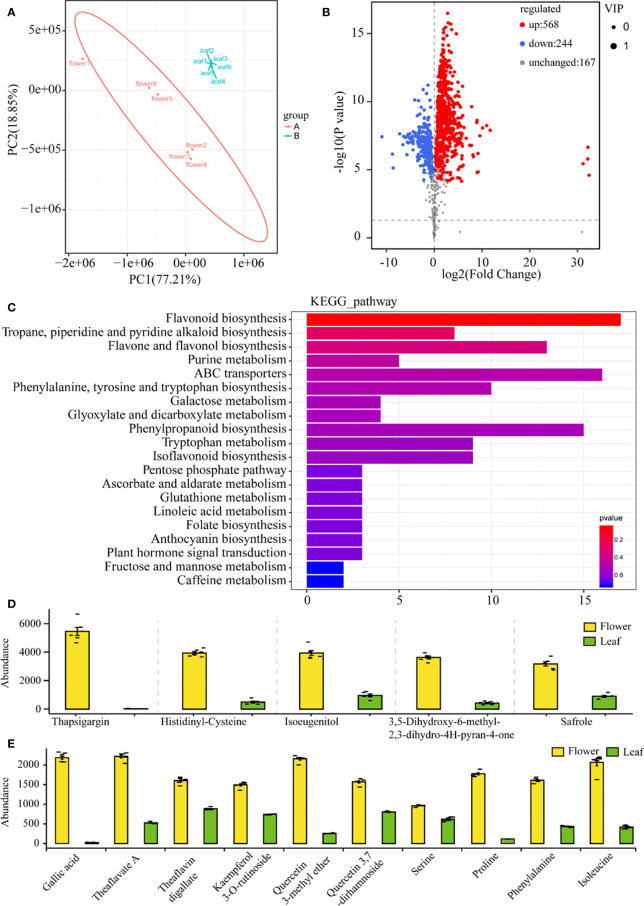
Figure 3.
Nontarget metabolic analysis of tea flowers and leaves. (A) Principal component analysis of tea flower and leaf samples. PC1, the first principal component. PC2, the second principal component. For each tissue samples, six biological replicates were prepared. (B) Volcano plots of differential metabolites in tea flower and leaf samples. (C) Kyoto Encyclopedia of Genes and Genomes pathway enrichment analysis of different metabolites in tea flower and leaf samples. (D) Five most abundant metabolites in tea flowers. (E) Differences in key metabolites between tea flowers and leaves.

