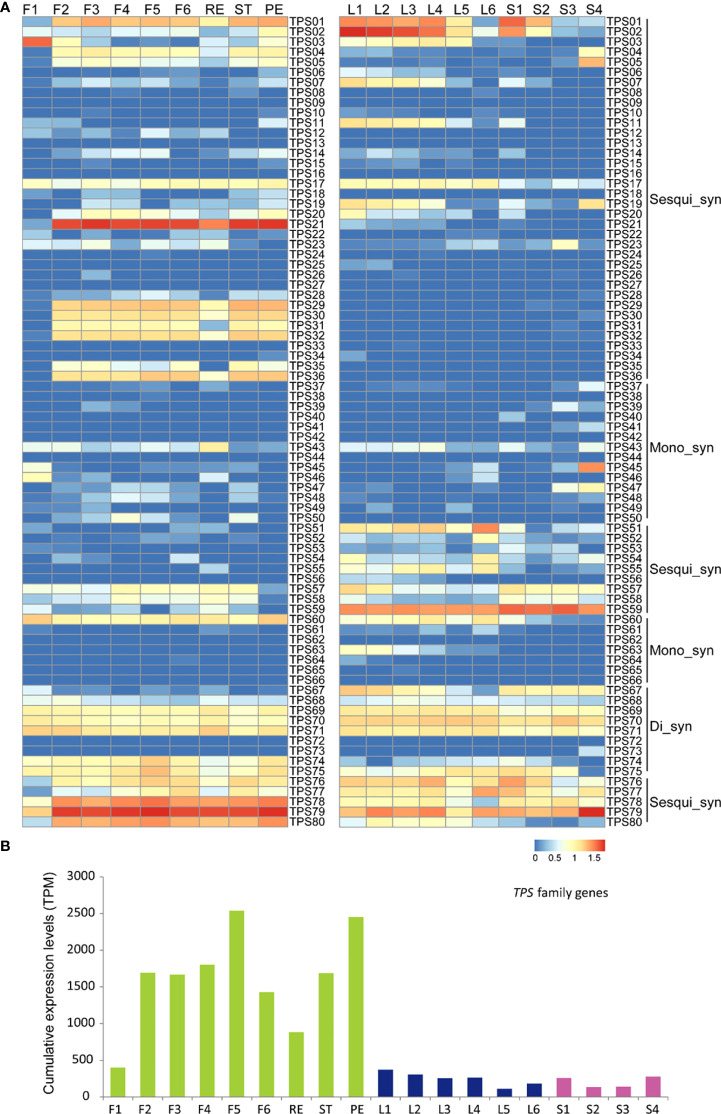
Figure 4.
Expression analysis of TPS gene family in tea developing flowers and leaves. (A) Heat map expression analysis of TPS genes involved in the terpenoid process in tea developing flowers and leaves. F1, tea flower stage 1; F2, tea flower stage 2; F3, tea flower stage 3; F4, tea flower stage 4; F5, tea flower stage 5; F6, tea flower stage 6; ST, stamen; PE, petal; RE, receptacle; L1, first tea leaf; L2, second tea leaf; L3, third tea leaf; L4, fourth tea leaf; L5, fifth tea leaf; and L6, sixth tea leaf; S1, internode between the first leaf and second leaf; S2, internode between the second leaf and third leaf; S3, internode between the third leaf and fourth leaf; S4, internode between the fourth leaf and fifth leaf; Mono_syn, monoterpene synthase; Sesqui_syn, sesquiterpene synthase; Di_syn, diterpene synthase. The expression level [log10(FPKM)] of each gene is shown in the heat map boxes. (B) Cumulative expression analysis of the TPS family genes in tea developing flowers and leaves.

