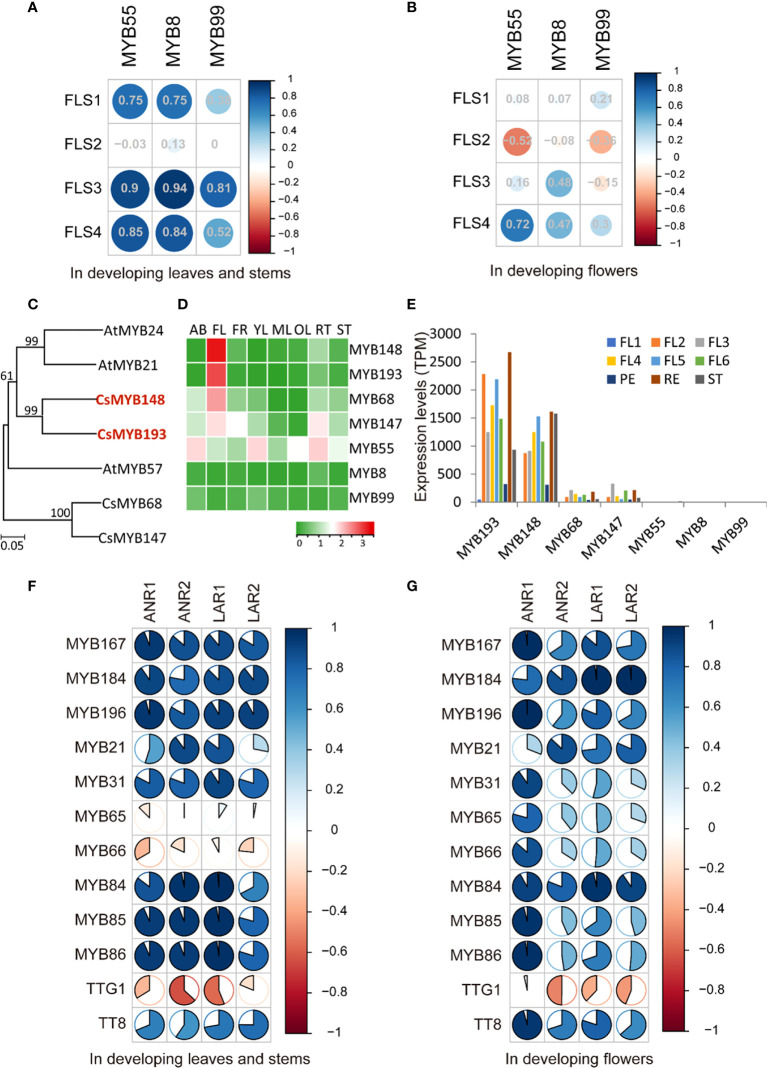
Figure 6.
Transcriptional regulatory mechanism of flavonol and catechin biosynthesis in tea flowers. (A, B) Pearson correlation analysis of the expression of FLS genes and the expression of three flavonol MYB regulator genes in developing leaves (A) and developing flowers (B). The sizes of circles indicate the degree of correlation. Green indicates a positive correlation, and red indicates a negative correlation. (C) Phylogenetic tree of tea MYBs with others related to flavonol biosynthesis regulation in flowers. The numbers at the nodes indicate the bootstrap value with 1,000 replicates. The red MYB genes highlight their corresponding homolog genes in tea plants. (D) Heat map expression analysis of candidate MYB genes in different tea tissues. AB, apical bud; FL, flower; FR, fruit; YL, young leaf; ML, mature leaf; OL, old leaf, RT, root, ST, stem. The expression level [log10(FPKM)] of each gene is shown in the heat map boxes. (E) Expression level analysis of candidate MYB genes regulating flavonol biosynthesis in tea developing flowers. (F, G) Pearson correlation analysis of the expression of ANR and LAR genes and the expression of catechin regulator genes in developing leaves (F) and developing flowers (G).

