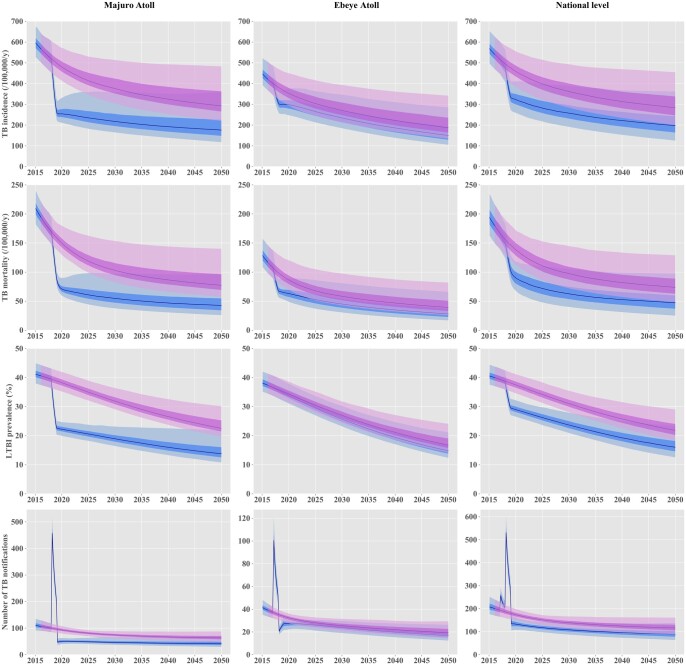
Figure 3.
Projected effect of the active screening interventions implemented in 2017 and 2018. The solid lines represent the median estimates. The shaded areas show the interquartile credible intervals (dark shade) and 95% credible intervals (light shade) projected in the absence of any intervention (pink) and under a scenario including the interventions implemented in 2017-18 in Majuro and Ebeye (blue). TB, tuberculosis; LTBI, latent tuberculosis infection

