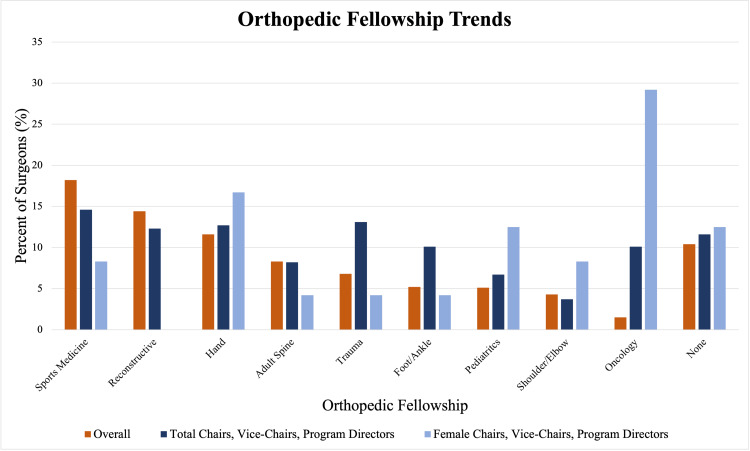
Figure 4. Orthopedic Fellowship Trends.
The following graph looks at the distribution of orthopedic fellowships in all orthopedics, females in orthopedics, all orthopedic chairs, vice-chairs, and PDs at academic institutions, and female orthopedic chairs, vice-chairs, and PDs at academic institutions. The data for the overall numbers for orthopedics came from the 2018 AAOS census. The data on chairs, vice-chairs, and PDs came from our own data.

