

Abstract
Objective
Cirrhosis is characterized by the complex interplay among biological, histological and haemodynamic events. Liver and spleen remodelling occur throughout its natural history, but the prognostic role of these volumetric changes is unclear. We evaluated the relationship between volumetric changes assessed by multidetector computerised tomography (MDCT) and landmark features of cirrhosis.
Methods
We included consecutive cirrhotic patients who underwent liver transplantation (LT) or hepatocellular carcinoma (HCC) resection in whom dynamic MDCT was available. Different volumetric indices were calculated. Fibrosis was evaluated by the collagen proportional area and Laennec sub‐stages. Correlation and logistic regression analysis were performed to explore associations of volumetric indexes and fibrosis with key prognostic features across the clinical stages of cirrhosis.
Results
185 patients were included (146 LT; 39 HCC); the predominant aetiology was viral hepatitis (51.35%); 65.9% had decompensated disease and 85.08% clinically significant portal hypertension (CSPH). The standardised liver volume and liver‐spleen volume ratio negatively correlated with Model for End‐stage Liver Disease (MELD), albumin and hepatic venous pressure gradient (HVPG) and were significantly lower in decompensated patients. The liver segmental volume ratio (segments I–III/segments IV–VIII) best captured the characteristic features of the compensated phase, showing a positive correlation with HVPG and a good discrimination between patients with and without CSPH and varices. Volumetric changes and fibrosis severity were independently associated with key prognostic events, with no association between these two parameters.
Conclusions
Liver and spleen volumetric indices evolve differently along the natural history of cirrhosis and are associated with key prognostic factors in each phase, regardless of fibrosis severity and portal hypertension.
Keywords: cirrhosis, fibrosis, natural history, portal hypertension, tomography
Key summary.
Established knowledge
Cirrhosis evolution is driven by a complex interplay among biological, histological, haemodynamic and clinical changes.
New Findings
Liver and spleen volumes change in a characteristic and quantifiable manner along the natural history of cirrhosis and are related to its clinical and haemodynamic landmarks.
This relationship between visceral volumes and prognosis in cirrhosis is independent of the extent of fibrosis. Assessment of liver and spleen volume by computerised tomography is easy and accessible, and may contribute to risk stratification in cirrhosis.
INTRODUCTION
Cirrhosis is a complex disease characterised by progressive replacement of the normal parenchyma by abnormal nodules and fibrous septa 1 leading to architectural distortion and parenchymal extinction. 2 , 3 These histopathological changes contribute to the development of portal hypertension which is variably followed by clinical decompensation and worsening of prognosis. 4 In recent decades, knowledge about the prognostic value of clinical, haemodynamic and histological findings and their respective interconnections has greatly increased. 5 , 6 , 7 Moreover, several sub‐stages integrating these different features have been defined in order to stratify risk. 8
On the other hand, some characteristic morphological changes such as left liver lobe hypertrophy, atrophy of the whole liver and splenomegaly occur along the natural history of cirrhosis. 9 , 10 These changes can be easily quantified with imaging techniques such as multidetector computerised tomography (MDCT). In fact, the estimation of liver volume (LV) by MDCT is widely used for assessing the feasibility of tumour resection 11 , 12 , 13 or living donor transplantation. 14 , 15 However, to what extent these morphological changes could be related to key events in cirrhosis has not been fully addressed. The aim of this study was to explore the relationship between landmark histological, haemodynamic, and clinical features of cirrhosis and changes in liver and spleen volumes.
MATERIALS AND METHODS
Patients
This cross‐sectional study included all cirrhotic patients who consecutively underwent liver transplantation (LT, n = 179) or resection of hepatocellular carcinoma (HCC, n = 41) during a 6‐year period (2009–2015) at the Hospital General Universitario Gregorio Marañón (Madrid, Spain), and in whom a cross‐sectional imaging study was available. Patients who received LT for acute liver failure (n = 14), amyloidosis (n = 1) or a history of liver resection prior to LT (n = 1) were excluded from the study as well as 13 patients (12 LT; 1 HCC) evaluated with magnetic resonance instead of MDCT and 6 patients (5 LT, 1 HCC) because MDCT was performed without intravenous contrast medium. The final study population comprised 185 patients (LT, n = 146; HCC, n = 39). Despite the potential bias generated by these criteria, we chose this population to obtain large histological samples, accurately accounting for the heterogeneous changes observed in cirrhosis (flowchart in Supplementary Figure S1).
Demographic, clinical, and haemodynamic data were obtained from electronic medical records.
Volumetric assessment
For volumetric analysis, the portal venous phase was reconstructed at 2 mm section thickness at 1 mm intervals. Multidetector computerised tomography acquisition settings were based on patient size and study indication. The Philips Intellispace V8 software was used for volumetric assessments. After manual selection of anatomical reference points, this package provides automatised segmentation of the liver. When the initial segmentation is completed, organ margins are verified and adjusted by the operator when necessary. This technique has been extensively described elsewhere 16 , 17 providing reproducible measurements with high inter‐ and intra‐reader agreement. All measurements were obtained by a radiologist (ER) with extensive experience in abdominal imaging. To assess the reproducibility of the method, volumetric analysis was repeated in a random sample of 10 cases by a second, independent, non‐radiologist, operator (DR).
The total LV and the volume of each liver segment and spleen volume (SV) were calculated and expressed in cm3. Previous population‐based studies have shown that anthropometric variability determines liver size regardless of the presence of liver disease, 18 , 19 therefore, we used several methods to standardise the total LV. We calculated for each patient the following volumetric ratios (Supplementary Figure S2):
-
(1)
SdLV (standardised LV by height and weight) 20 : the measured total LV/theoretical standard LV according to height and weight.
-
(2)
SdLV‐TD (standardised LV by thoracic diameter (TD)) 21 : the measured total LV/theoretical standard LV according to TD.
A value of 1 for these ratios indicates that the patient has a normal LV standardised for a healthy person of the same anthropometric parameters, while a value less than 1 would indicate a decrease in LV as compared to the standard volume.
-
(3)
The standardisation of LV on body weight (SdLV‐BW) (standardised LV by body weight): the measured total LV (cm3)/body weight (Kg).
-
(4)
The liver segmental volume ratio (LSVR) 22 : the ratio between the volume of segments I to III and the segments IV to VIII. This ratio is considered as a radiological sign of cirrhosis 23
-
(5)
The LV/SV (liver to SV ratio): the ratio between liver and spleen volumes. This ratio has previously been associated with the severity of fibrosis and the presence of portal hypertension. 24 , 25 , 26
Histological assessment
Conventional histopathological analysis
Histological samples were obtained from the right lobe (except in seven patients with left lobe resection). Five micrometre sections were prepared and stained with haematoxylin and eosin and Masson‐trichrome. Samples were analysed by a pathologist expert in liver histology (IP) according to a pre‐specified semi‐quantitative scale (Supplementary Table 1). Sub‐classification of cirrhosis was made according to Laennec sub‐stages. 6
Digital image analysis for quantification of fibrosis
Digital image analysis after Sirius red staining was used to quantify fibrosis as previously described. 27 For this purpose, we used a digital camera (Olympus SZ.17) connected to a compatible personal computer. The ImageJ® processing software was used to calculate the collagen proportional area (CPA) following the methodology described elsewhere. 27 , 28 , 29
Fibrosis‐free liver volume
To estimate the proportion of liver parenchyma free of fibrosis, we combined the data obtained by MDCT and CPA into a single variable, following the square‐cube mathematical principle first described by Galileo Galilei in 1638. 30 To calculate the total volume of fibrosis we considered each individual CPA as a representative two‐dimensional estimation of the amount of fibrosis. Then, we transformed this factor from a quadratic to a cubic scale raising it to the power of 3/2. This factor was applied to the total LV obtained in the MDCT. Finally, we obtained the standardised fibrosis‐free liver volume (Ff‐LV) by removing the estimated fibrosis volume from the total LV and dividing this result by the standard LV (real example in Supplementary Figure S3).
Statistics
Quantitative variables are expressed as mean (standard deviation) or median (range) as appropriate. Categorical variables are shown as proportions (percent). The correlation between the total LV calculated by MDCT and the liver weight in those patients who underwent LT was analysed by Pearson correlation test.
To explore the association between visceral volumes and key features of the disease, the Spearman correlation test was used for continuous variables (scatterplots and 95% confidence level density ellipses were plotted for these bivariate distributions) whilst the Student's t, or ANOVA (with Bonferroni correction) tests were used for categorical variables. The χ2 or the Fisher tests were applied to analyse the relationship between categorical variables.
Univariate and multivariate logistic regression analysis were performed to investigate variables independently associated with clinically significant portal hypertension (CSPH: HVPG ≥10 mmHg 31 ) or clinical decompensation. A modelling strategy was followed including the aetiology of liver disease, volumetric changes and histological findings as explanatory variables. A backward stepwise method was used (p < 0.05 and p < 0.10 values as inclusion and exclusion criteria). We repeated this analysis including obesity (defined as body mass index [BMI] >30 kg/m2) as an explanatory variable representing a surrogate of non‐alcoholic steatohepatitis (NASH).
The intraclass correlation coefficient for absolute agreement (mixed effect model) was applied to assess the reproducibility of volume measurements obtained by the two different operators.
Significance testing was two‐sided, and type 1 error rates were set at 0.05. All the calculations were performed with Stata version 14.0.
Ethical issues
The study was approved by the Ethics Committee of Hospital General Universitario Gregorio Marañón (dated 24 March 2014).
RESULTS
Characteristics of the patients
The study population comprised mostly male patients (161/185, 87%) with a mean age of 55.39 (8.48) years. The aetiology of cirrhosis was predominantly viral hepatitis (113/185, 61.08%) and alcohol (53/185, 28.65%). The spectrum of cirrhosis severity was homogeneously represented (Child‐Pugh A, B and C: 37.50%, 32.95% and 29.55%, respectively). Twenty‐seven (14.92%), 32 (17.68%) and 122 (67.40%) patients had compensated cirrhosis without CSPH, compensated cirrhosis with CSPH and decompensated cirrhosis, respectively (HVPG was not available in 4 compensated patients). The median Model for end‐stage liver disease (MELD) score was 11 (6–40) points, and the median HVPG was 16 mmHg (2.5–41.5 mmHg). The mean area of the histological samples used for CPA analysis was 2.43 (0.84) cm2. The cohort distribution according to the Laennec sub‐classification was 32.76%, 41.80% and 26.44% for stages 4a, 4b and 4c, respectively. Upper gastrointestinal endoscopy, HVPG and cardiac index, all performed close to MDCT, were available in 178, 147 and 105 cases, respectively. The median time between surgery (LT or resection) and MDCT, endoscopy and the haemodynamic study was less than 10 months.
The demographic data, and the characteristics of liver disease and visceral volumes are shown in Table 1.
TABLE 1.
Characteristics of study population
| Demographics | ||
| Age (years) | 55.39 | (8.48) |
| Male sex | 161/185 | (87.03) |
| Weight (kg) | 77.43 | (13.04) |
| Height (m) | 1.68 | (0.07) |
| BMI (Kg/m2) | 27.24 | (3.82) |
| Weight of the liver in patients with LT (gr) a | 1301.30 | (408.89) |
| Cardiovascular risk factors | ||
| Diabetes mellitus | 53/185 | (28.65) |
| Arterial hypertension | 47/185 | (25.41) |
| Dyslipidemia | 21/185 | (35.35) |
| History of active or previous smoking | 111/177 | (62.71) |
| Aetiology of liver disease | ||
| Hepatitis C virus | 95/185 | (51.35) |
| Alcohol | 53/185 | (28.65) |
| Hepatitis B virus | 18/185 | (9.73) |
| NASH | 8/185 | (4.32) |
| Autoimmune hepatitis | 4/185 | (2.16) |
| Primary biliary cholangitis | 3/185 | (1.62) |
| Primary sclerosing cholangitis | 3/185 | (1.62) |
| Haemochromatosis | 1/185 | (0.54) |
| Hepatocellular carcinoma | ||
| All cases | 116/185 | (62.70) |
| 1 nodule | 78/116 | (67.24) |
| 2 nodules | 29/116 | (25.00) |
| 3 or more nodules | 9/116 | (7.76) |
| Oesophageal varices | ||
| No varices | 41/178 | (23.03) |
| Small | 77/178 | (43.26) |
| Large | 58/178 | (32.56) |
| Isolated gastric varices | 2/178 | (1.12) |
| Previous variceal bleeding | 42/185 | (22.70) |
| Previous hepatic encephalopathy | ||
| No | 110/185 | (59.46) |
| Grade I–II | 67/185 | (36.22) |
| Grade III–IV | 8/185 | (4.32) |
| Ascites | ||
| No | 71/185 | (38.38) |
| Diuretic‐responsive | 66/185 | (35.68) |
| Refractory | 48/185 | (25.95) |
| Previous spontaneous bacterial peritonitis | 44/185 | (23.78) |
| Laboratory values | ||
| Platelets (x103/μl) | 92.79 | (56.35) |
| Bilirubin (mg/dl) | 3.54 | (5.31) |
| INR | 1.31 | (0.40) |
| Creatinine (mg/dl) | 0.91 | (0.38) |
| Sodium (mmol/L) | 137 | (4.9) |
| Albumin (g/dl) | 3.45 | (0.69) |
| Volumetric calculations (cm3) | ||
| Total liver volume | 1423.14 | (449.97) |
| Segment I | 39.8 | (35.47) |
| Segment II | 177.86 | (97.81) |
| Segment III | 213.80 | (160.57) |
| Segment IVa | 109.39 | (54.49) |
| Segment IVb | 52.14 | (40.66) |
| Segment V | 225.93 | (112.14) |
| Segment VI | 168.44 | (84.82) |
| Segment VII | 213.47 | (95.65) |
| Segment VIII | 228.24 | (92.71) |
| Spleen volume | 779.22 | (458.38) |
Note: Data are expressed as mean (SD) or as proportion (%).
Abbreviations: BMI, body mass index; INR, international normalized ratio; LT, liver transplantation; NASH, non‐alcoholic steatohepatitis.
The weight of the whole liver in patients with LT was available in 140/146 cases.
Correlation between liver volume and liver weight and reproducibility of the volume measurements
Overall, there was a strong correlation between liver weight and LV estimated by MDCT (r = 0.92; p < 0.01) which was similar among the different Child‐Pugh classes (r = 0.88, p < 0.01; r = 0.96, p < 0.01; and r = 0.84, p < 0.01; for Child A, B and C, respectively) and aetiologies (r = 0.95, p < 0.01; r = 0.83, p < 0.01; and r = 0.93, p < 0.01; for viral, alcoholic and other aetiologies, respectively).
Agreement between the two independent operators in volume measurements was excellent [intraclass correlation coefficient (95% confidence interval of 0.9991 (0.9965–0.9997), 0.9970 (0.9835–0.9993) and 0.9757 (0.9056–0.9939) for total LV, SV and LSVR, respectively].
Association between visceral volumes and severity of liver disease
The SdLV and the LV/SV but not the LSVR, showed a significant correlation with the MELD score and serum albumin. Furthermore, the SdLV and LV/SV were significantly lower in decompensated patients (overall and for each specific decompensation). Conversely, the LSVR was similar in patients with and without previous decompensation (Figure 1).
FIGURE 1.

Association between visceral volume indices, clinical events and variables related to liver failure. LSVR, liver segmental volume ratio (segments I‐III/segments IV‐VIII); LV/SV, liver to spleen volume (SV) ratio; MELD, model for end stage liver disease; SdLV, standardised liver volume (LV) according to height and weight
Association between visceral volumes and portal hypertension hallmarks
We found a positive correlation between the HVPG and LSVR. Conversely, the HVPG was negatively correlated with the SdLV and LV/SV. Furthermore, patients with CSPH had a significantly lower SdLV and LV/SV and a higher LSVR. Similar findings were observed for the presence of oesophageal varices (Figure 2).
FIGURE 2.

Association between visceral volume indices and variables related to portal hypertension. CSPH, clinically significant portal hypertension; HVPG, hepatic venous pressure gradient; LSVR, liver segmental volume ratio (segments I‐III/segments IV‐VIII); LV/SV, liver to spleen volume (SV) ratio; SdLV, standardised liver volume (LV) according to height and weight
If considering only compensated patients, a significant correlation in the same direction was found between the HVPG and the LSVR and LV/SV. The presence of CSPH or gastroesophageal varices was also associated with a significant variation in LSVR and LV/SV. However, we did not find association between the SdLV and the HVPG, the presence of CSPH or varices in this subgroup of patients (Supplementary Figure S4).
Association between visceral volumes and fibrosis
None of the volumetric ratios were associated with the intensity of fibrosis, estimated by the Laennec sub‐classification or CPA (Figure 3).
FIGURE 3.

Association between volume indices and severity of fibrosis. CPA, collagen proportional area; LSVR, liver segmental volume ratio (segments I‐III/segments IV‐VIII); LV/SV, liver to spleen volume (SV) ratio; SdLV, standardised liver volume (LV) according to height and weight
As expected, fibrosis deposition was significantly greater in patients with decompensated disease and its severity increased in accordance with the prognostic scores (Child‐Pugh, MELD score) and the clinical, haemodynamic or endoscopic findings (Supplementary Table S2).
The associations between other histological findings and splanchnic volumes are summarised in Supplementary Table S3.
Relationship between liver volume, fibrosis and prognostic events
As shown previously, liver and spleen volumes and the severity of fibrosis, individually, are clearly associated with key features of the disease and its severity. Nevertheless, no association was found between visceral volumes and fibrosis. We next explored the association of these variables with the development of CSPH or clinical decompensation when considered simultaneously.
-
(A)
Relationship between LV changes and clinical decompensation across the fibrosis severity spectrum.
As shown in Figure 4, the SdLV was significantly lower in decompensated patients along the different degrees of fibrosis (Laennec substages or quartiles of CPA).
FIGURE 4.
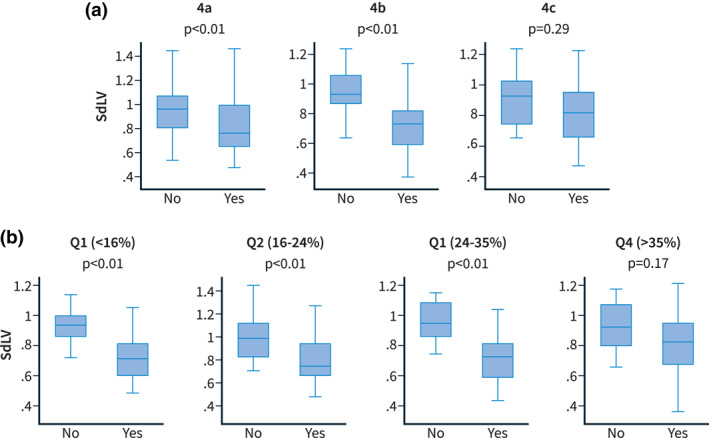
Comparison of SdLV distribution in patients with and without clinical decompensation across fibrosis stages according to the Laennec classification (a) and consecutive quartiles of collagen proportional area (CPA) (%) (b). CPA, collagen proportional area; SdLV, standardised liver volume (LV) according to height and weight
To evaluate the independent contribution of volumetric liver indices (SdLV and LSVR) and the severity of fibrosis to the presence of CSPH or clinical decompensation, different explicative models were developed (Table 2). The aetiology of liver disease, SdLV, LSVR and CPA were independently associated with the presence of CSPH. On the other hand, the aetiology, SdLV and CPA but not the LSVR were found to be independent factors associated with clinical decompensation. Interestingly, when the HVPG was included as a covariate in the last model, only the HVPG and the SdLV remained as independent variables. Additionally, when we included in the model the presence of obesity (BMI >30 kg/m2) as a surrogate of NASH, the results were similar (Supplementary Table S4).
-
(B)
Relationship between standardised Ff‐LV and disease severity
TABLE 2.
Logistic regression analysis for the presence of clinically significant portal hypertension (CSPH) or clinical decompensation
| Dependent variable: Presence of CSPH | ||||
|---|---|---|---|---|
| Variable | Univariate | Multivariate | ||
| OR (95% CI) | p | OR (95% CI) | p | |
| Aetiology (viral as reference) | ||||
| ‐Alcoholic versus viral | 2.71 (0.87–8.47) | 0.086 | 5.78 (1.38–24.25) | 0.017 |
| ‐Others versus viral | 0.79 (0.25–2.47) | 0.684 | 2.42 (0.52–11.33) | 0.262 |
| SdLV | 0.18 (0.04–0.73) | 0.016 | 0.07 (0.01–0.51) | 0.008 |
| LSVR | 15.15 (1.63–140.62) | 0.017 | 16.52 (1.36–200.38) | 0.028 |
| CPA (%) | 1.08 (1.04–1.14) | 0.001 | 1.09 (1.03–1.15) | 0.002 |
| Dependent variable: Presence of clinical decompensation | ||||
|---|---|---|---|---|
| Variable | Univariate | Multivariate | ||
| OR (95% CI) | p | OR (95% CI) | p | |
| Aetiology (viral as reference) | ||||
| ‐Alcoholic versus viral | 2.35 (1.09–5.04) | 0.029 | 3.64 (1.42–9.37) | 0.007 |
| ‐Others versus viral | 0.68 (0.26–1.81) | 0.444 | 2.60 (0.71–9.54) | 0.149 |
| SdLV | 0.06 (0.02–0.24) | 0.000 | 0.02 (0.00–0.11) | 0.000 |
| LSVR | 1.80 (0.39–8.44) | 0.453 | ||
| CPA (%) | 1.06 (1.03–1.10) | 0.000 | 1.06 (1.03–1.10) | 0.001 |
| Dependent variable: Presence of clinical decompensation (considering HVPG in the model) | ||||
|---|---|---|---|---|
| Variable | Univariate | Multivariate | ||
| OR (95% CI) | p | OR (95% CI) | p | |
| Aetiology (viral as reference) | ||||
| ‐Alcoholic versus viral | 2.35 (1.09–5.04) | 0.029 | 1.78 (0.54–5.84) | 0.344 |
| ‐Others versus viral | 0.68 (0.26–1.81) | 0.444 | 2.01 (0.37–10.87) | 0.419 |
| SdLV | 0.06 (0.02–0.24) | 0.000 | 0.07 (0.01–0.59) | 0.015 |
| LSVR | 1.80 (0.39–8.44) | 0.453 | ||
| CPA (%) | 1.06 (1.03–1.10) | 0.000 | 1.01 (0.97–1.06) | 0.514 |
| HVPG (mmHg) | 1.33 (1.21–1.46) | 0.000 | 1.28 (1.16–1.42) | 0.000 |
Abbreviations: CPA, collagen proportional area; LSVR, liver segmental volume ratio (Couinaud segments I‐III to Couinaud segments IV‐ VIII); SdLV, liver volume standardised by height and weight.
The Ff‐LV discriminated better than CPA or SdLV across the different Child‐Pugh classes or HVPG strata (Supplementary Figure S5). Additionally, the reduction of portal tracts and central veins, two histological changes closely related to parenchymal extinction, were associated with a reduction in Ff‐LV (Figure 5). We found that a differential contribution of CPA and SdLV changes may lead to a similar reduction of Ff‐LV, and eventually, to a similar clinical scenario (Supplementary Figure S6).
FIGURE 5.

Variation of fibrosis‐free liver volume (Ff‐LV) according to the loss of portal tracts and central veins. Ff‐LV, standardised fibrosis‐free liver volume
The Table 3 provides a comprehensive summary of the histological, haemodynamic, biochemical and splanchnic volume changes according to the different clinical stages of cirrhosis.
TABLE 3.
Distribution of histological, haemodynamic, biochemical and volume changes according to the different clinical risk groups in cirrhosis

|
Note: Group I: compensated without risk (HVPG <10 mmHg); Group II: compensated at risk (HVPG ≥10 mmHg); Group III: Decompensated. Data are expressed as means [SD] or as proportions (%). ANOVA for mean comparison among groups and Chi‐squared test for comparison of categorical variables. A different intensity colour between categories represents a p‐value <0.05.
Abbreviations: CPA, collagen proportional area; HVPG, hepatic venous pressure gradient; LSVR, liver segmental volume ratio (segments I–II /segments IV–VIII); LV/SV, liver to spleen volume ratio; MELD, model for end stage liver disease; SdLV, standardised liver volume according to height and weight.
All the previous analyses were also performed using the standardisations of LV based on thoracic diameter and on body weight (SdLV‐BW), showing similar results (Supplementary Tables S5 and S6).
DISCUSSION
Cirrhosis is a heterogeneous disease driven by a complex interplay among biological, histological, haemodynamic and clinical changes. All these events define the natural history of the disease and allow its stratification in terms of severity and prognosis. 8 The pathophysiological and prognostic role of volumetric changes throughout the different stages is unclear. In this study we aimed to explore the relationship between changes in the liver and spleen volumes and the landmark histological, haemodynamic, and clinical features of cirrhosis.
First, our results demonstrate that liver and spleen volumetric changes evaluated by MDCT can be detected across the different stages mirroring the natural history of cirrhosis. Second, we showed that these volumetric changes do not evolve homogeneously over time, but rather specific volumetric changes are related to different phases (compensated without CSPH, compensated with CSPH and decompensated). It is of note that the volumetric changes are related to these evolutive phases of cirrhosis independently of the intensity of fibrosis.
We found two pivotal changes in the volumetric indices that closely correlated with each of the clinical phases: (1) a relative atrophy of the right lobe and medial sector of the left lobe (segments IV–VIII) along with hypertrophy of the left lateral sector and caudate lobe (segments I–III). This phenomenon seems to begin in the pre‐cirrhotic stages and evolves along the compensated phase. The underlying drivers of this process still remain to be elucidated, but several mechanisms have been proposed. 32 , 33 The LSVR is the volumetric index that best captures this pathophysiological process. The LSVR showed a positive correlation with HVPG, the most robust prognostic factor in compensated cirrhosis. Moreover, it discriminated between patients with CSPH (i.e. at risk of decompensation) and those without it, regardless of the whole LV or the extent of fibrosis. Importantly, this is the first study that demonstrates that the LSVR does not undergo significant changes during the decompensated phase. (2) the second pivotal change was a progressive atrophy of the whole liver. This phenomenon occurs during the decompensated phase. The SdLV was significantly correlated with well‐known prognostic factors of decompensated cirrhosis. We hypothesised that SdLV changes are mainly secondary to parenchymal extinction. This histopathological event is a key feature in disease progression resulting in loss of functioning parenchyma. 3 The reduction in LV was associated with the development of decompensation independently of the intensity of fibrosis, thereby supporting our hypothesis.
Another remarkable finding of our study was that LV changes and fibrosis severity independently contribute to prognosis. In fact, decompensated patients showed a significantly lower LV than compensated patients across the different Laennec stages. Although speculative, it may be possible that fibrosis deposition and parenchymal extinction are partially overlapped mechanisms that impact disease progression: (a) fibrosis is mainly implicated in the development of architectural distortion during the compensated phase, and the relative hypertrophy of segments I‐III would be a compensatory mechanism in response to the atrophy of segments IV‐VIII; and (b) progressive extinction of functioning parenchyma would be responsible for the loss of hepatic volume, the progressive increase in portal hypertension, and eventually, the development of clinical decompensation. Therefore, the results of our investigation challenge the current histopathological sub‐classification of cirrhosis and its correlation with the key events within the decompensated phase of the disease. Certainly, and in line with previous data, 6 decompensated patients had a greater fibrosis deposition. However, this finding does not unequivocally imply that fibrosis severity triggers the development of clinical decompensation, but rather that other factors easily evaluated by visceral volumetry, such as functional parenchymal collapse, are more relevant in this phase. A recent study showed that the severity of fibrosis assessed by CPA correlates with the clinical severity until a decompensation occurs but not with subsequent decompensating events. 34 Overall, these findings could explain that some patients could have less severe fibrosis, concomitantly with marked parenchymal extinction, leading to decrease LV.
The methodology followed confers additional strength to the results. We included a large and well‐characterised cohort, partially representative of the entire spectrum of cirrhosis severity. Importantly, in contrast with previous studies using small needle samples, 6 , 7 , 27 we included high quality histological specimens from hepatic surgical procedures. Finally, and considering that population‐based studies have shown that anthropometric variability determines the size of the liver, 18 , 19 we standardised the volumetric determinations. We have shown that standardisation using TD leads to identical results; thus, LV can be measured and standardised just with MDCT‐related information.
Therefore, visceral volumetry by MDCT is an easy, reproducible and non‐invasive tool which provides valuable prognostic information in cirrhosis. Our results invite prospective investigation of the ability of liver and spleen volumetry to predict histological, haemodynamic and clinical events in order to provide a point‐of‐care risk assessment in both compensated and decompensated patients.
Our study has some limitations. We only included cirrhotic patients who underwent LT or liver resection, which might introduce selection bias. However, the characteristics of the patients regarding demographics, liver disease severity and haemodynamic findings, are similar to those reported in other series. 35 Our cohort comprised mostly patients with hepatitis C or alcohol‐related cirrhosis and less than 5% of the cases were secondary to NASH, an aetiology that is highly prevalent nowadays. 36 To overcome this limitation, we adjusted the volume indexes to the anthropometric condition of the patients and included a sub‐analyses incorporating the BMI as a surrogate of NASH. Additionally, there is evidence showing that the amount of steatosis (a possible influencing factor on LV measurements), decreases in advance NASH disease. 37 However, whether our findings are equally valid in NASH patients should be specifically explored in further studies. The inherent retrospective nature and cross‐sectional design of our study precluded the evaluation of longitudinal changes in individual patients. Although a longitudinal study with prolonged follow‐up and repeated measurements would be ideal to fully confirm our findings, such a study is very difficult to perform considering the invasive nature of obtaining repeated liver samples and HVPG measurements.
In conclusion, liver and spleen volumetric changes parallel the natural history of cirrhosis, correlate with the clinical stages and are associated with its prognostic factors, regardless of the severity of fibrosis. These volumetric indices can be easily obtained and reproduced by MDCT and provide relevant prognostic information in patients with cirrhosis across the entire spectrum of the disease.
AUTHOR CONTRIBUTIONS
Conceptualization: Mario Romero‐Cristóbal, Ana Clemente‐Sánchez, Rafael Bañares, Diego Rincón. Acquisition of data: Mario Romero‐Cristóbal, Ana Clemente‐Sánchez, María‐Isabel Peligros, Enrique Ramón, Ana‐María Matilla, Arturo Colón, Sonia Alonso, María‐Vega Catalina, Ainhoa Fernández‐Yunquera, Rita García, Jose Ángel López‐Baena, María‐Magdalena Salcedo, Rafael Bañares, Diego Rincón. Formal analysis and methodology: Mario Romero‐Cristóbal, Ana Clemente‐Sánchez, María‐Isabel Peligros, Enrique Ramón, Rafael Bañares, Diego Rincón. Project administration: Rafael Bañares, Diego Rincón. Writing ‐ original draft: Mario Romero‐Cristóbal, Ana Clemente‐Sánchez, Rafael Bañares, Diego Rincón. Writing–review and editing: Mario Romero‐Cristóbal, Ana Clemente‐Sánchez, Rafael Bañares, Diego Rincón.
CONFLICT OF INTEREST
No conflict of interest to declare.
ETHICS APPROVAL
The study protocol conforms to the ethical guidelines of the 1975 Declaration of Helsinki as reflected in a priori approval by the institution's human research committee. Institutional Review Board approval was obtained. Written informed consent was waived by the Institutional Review Board.
Supporting information
Supplementary Figure S1
Supplementary Figure S2
Supplementary Figure S3
Supplementary Figure S4
Supplementary Figure S5
Supplementary Figure S6
Supplementary Table S1
Supplementary Table S2
Supplementary Table S3
Supplementary Table S4
Supplementary Table S5
Supplementary Table S6
ACKNOWLEDGEMENT
This study is part of a project that has obtained research funds from the Instituto de Salud Carlos III in a competitive call (project code: PI15/02037). Ana Clemente‐Sánchez is funded by an international scholarship sponsored by the Spanish Association of the Study of the Liver (AEEH).
Romero‐Cristóbal M, Clemente‐Sánchez A, Peligros M‐I, Ramón E, Matilla A‐M, Colón A, et al. Liver and spleen volumes are associated with prognosis of compensated and decompensated cirrhosis and parallel its natural history. United European Gastroenterol J. 2022;10(8):805–16. 10.1002/ueg2.12301
Mario Romero‐Cristóbal and Ana Clemente‐Sánchez share first authorship.
Rafael Bañares and Diego Rincón share senior authorship.
DATA AVAILABILITY STATEMENT
Data generated or analysed during the study are available from the corresponding author by request.
REFERENCES
- 1. Anthony PP, Ishak KG, Nayak NC, Poulsen HE, Scheuer PJ, Sobin LH. The morphology of cirrhosis. Recomendations on definition, nomenclature, and classification bya a working group sponsored by the World Health Organization. J Clin Pathol. 1978;31(5):395–414. 10.1136/jcp.31.5.395 [DOI] [PMC free article] [PubMed] [Google Scholar]
- 2. Wanless IR, Nakashima E, Sherman M. Regression of human cirrhosis: Morphologic features and the genesis of incomplete septal cirrhosis. Arch Pathol Lab Med. 2000;124(11):1599–607. 10.5858/2000-124-1599-rohc [DOI] [PubMed] [Google Scholar]
- 3. Wanless IR, Wong F, Blendis LM, Greig P, Heathcote EJ, Levy G. Hepatic and portal vein thrombosis in cirrhosis: possible role in development of parenchymal extinction and portal hypertension. Hepatology. 1995;21(5):1238–47. 10.1016/0270-9139(95)90043-8 [DOI] [PubMed] [Google Scholar]
- 4. Moreau R, Jalan R, Gines P, Pavesi M, Angeli P, Cordoba J, et al. Acute‐on‐Chronic liver failure is a distinct syndrome that develops in patients with acute decompensation of cirrhosis. Gastroenterology. 2013;144(7):1426–37. 10.1053/j.gastro.2013.02.042 [DOI] [PubMed] [Google Scholar]
- 5. D’Amico G, Garcia‐Tsao G, Pagliaro L. Natural history and prognostic indicators of survival in cirrhosis: a systematic review of 118 studies. J Hepatol. 2006;44(1):217–31. 10.1016/j.jhep.2005.10.013 [DOI] [PubMed] [Google Scholar]
- 6. Kim MY, Cho MY, Baik SK, Park HJ, Jeon HK, Im CK, et al. Histological subclassification of cirrhosis using the Laennec fibrosis scoring system correlates with clinical stage and grade of portal hypertension. J Hepatol. 2011;55(5):1004–9. 10.1016/j.jhep.2011.02.012 [DOI] [PubMed] [Google Scholar]
- 7. Sethasine S, Jain D, Groszmann RJ, Garcia‐Tsao G. Quantitative histological‐hemodynamic correlations in cirrhosis. Hepatology. 2012;55(4):1146–53. 10.1002/hep.24805 [DOI] [PMC free article] [PubMed] [Google Scholar]
- 8. Garcia‐Tsao G, Friedman S, Iredale J, Pinzani M. Now there are many (stages) where before there was one: in search of a pathophysiological classification of cirrhosis. Hepatology. 2010;51(4):1445–9. 10.1002/hep.23478 [DOI] [PMC free article] [PubMed] [Google Scholar]
- 9. Berzigotti A, Seijo S, Arena U, Abraldes JG, Vizzutti F, Garcia‐Pagan JC, et al. Elastography, spleen size, and platelet count identify portal hypertension in patients with compensated cirrhosis. Gastroenterology. 2013;144(1):102–11.e1. 10.1053/j.gastro.2012.10.001 [DOI] [PubMed] [Google Scholar]
- 10. Zoli M, Cordiani M, Marchesini G, Iervese T, Labate A, Bonazzi C, et al. Prognostic indicators in compensated cirrhosis. Am J Gastroenterol. 1991;86:1508–13. [PubMed] [Google Scholar]
- 11. Ferrero A, Viganò L, Polastri R, Muratore A, Eminefendic H, Regge D, et al. Postoperative liver dysfunction and future remnant liver: where is the limit? Results of a prospective study. World J Surg. 2007;31(8):1643–51. 10.1007/s00268-007-9123-2 [DOI] [PubMed] [Google Scholar]
- 12. Guglielmi A, Ruzzenente A, Conci S, Valdegamberi A, Iacono C. How much remnant is enough in liver resection? Dig Surg. 2012;29(1):6–17. 10.1159/000335713 [DOI] [PubMed] [Google Scholar]
- 13. Kishi Y, Abdalla EK, Chun YS, Zorzi D, Madoff DC, Wallace MJ, et al. Three hundred and one consecutive extended right hepatectomies. Ann Surg. 2009;250(4):540–8. 10.1097/sla.0b013e3181b674df [DOI] [PubMed] [Google Scholar]
- 14. Chen YS, Cheng YF, De Villa VH, Wang CC, Lin CC, Huang TL, et al. Evaluation of living liver donors. Transplantation. 2003;75:s16–19. 10.1097/01.tp.0000046535.49186.eb [DOI] [PubMed] [Google Scholar]
- 15. Ben‐Haim M, Emre S, Fishbein TM, Sheiner PA, Bodian CA, Kim‐Schluger L, et al. Critical graft size in adult‐to‐adult living donor liver transplantation: impact of the recipient’s disease. Liver Transplant. 2001;7(11):948–5. 10.1053/jlts.2001.29033 [DOI] [PubMed] [Google Scholar]
- 16. Furusato Hunt OM, Lubner MG, Ziemlewicz TJ, Muñoz del Rio A, Pickhardt PJ. The liver segmental volume ratio for noninvasive detection of cirrhosis: comparison with established linear and volumetric measures. J Comput Assist Tomogr. 2016;40(3):478–84. 10.1097/rct.0000000000000389 [DOI] [PMC free article] [PubMed] [Google Scholar]
- 17. Yoneyama T, Asonuma K, Okajima H, Lee KJ, Yamamoto H, Takeichi T, et al. Coefficient factor for graft weight estimation from preoperative computed tomography volumetry in living donor liver transplantation. Liver Transplant. 2011;17(4):369–72. 10.1002/lt.22239 [DOI] [PubMed] [Google Scholar]
- 18. Kratzer W, Fritz V, Mason RA, Haenle MM, Kaechele V. Factors affecting liver size: a sonographic survey of 2080 subjects. J Ultrasound Med. 2003;22(11):1155–61. 10.7863/jum.2003.22.11.1155 [DOI] [PubMed] [Google Scholar]
- 19. Kromrey ML, Ittermann T, vWahsen C, Plodeck V, Seppelt D, Hoffmann RT, et al. Reference values of liver volume in Caucasian population and factors influencing liver size. Eur J Radiol. 2018;106:32–7. 10.1016/j.ejrad.2018.07.005 [DOI] [PubMed] [Google Scholar]
- 20. Heinemann A, Wischhusen F, Püschel K, Rogiers X. Standard liver volume in the Caucasian population. Liver Transplant Surg. 1999;5:366–8. 10.1002/lt.500050516 [DOI] [PubMed] [Google Scholar]
- 21. Kokudo T, Hasegawa K, Uldry E, Matsuyama Y, Kaneko J, Akamatsu N, et al. A new formula for calculating standard liver volume for living donor liver transplantation without using body weight. J Hepatol. 2015;63(4):848–54. 10.1016/j.jhep.2015.05.026 [DOI] [PubMed] [Google Scholar]
- 22. Pickhardt PJ, Malecki K, Hunt OF, Beaumont C, Kloke J, Ziemlewicz TJ, et al. Hepatosplenic volumetric assessment at MDCT for staging liver fibrosis. Eur Radiol. 2017;27(7):3060–8. 10.1007/s00330-016-4648-0 [DOI] [PubMed] [Google Scholar]
- 23. Lubner MG, Pickhardt PJ. Multidetector computed tomography for retrospective, noninvasive staging of liver fibrosis. Gastroenterol Clin N Am. 2018;47(3):569–84. 10.1016/j.gtc.2018.04.012 [DOI] [PubMed] [Google Scholar]
- 24. Ouyang GX, Zhang YM, Zhu SL, Wang P, Ren Y, Li JH, et al. A novel, non‐invasive model for diagnosing liver fibrosis stage in patients with hepatocellular carcinoma. Sci Rep. 2018;8(1):13074. 10.1038/s41598-018-31351-3 [DOI] [PMC free article] [PubMed] [Google Scholar]
- 25. Iranmanesh P, Vazquez O, Terraz S, Majno P, Spahr L, Poncet A, et al. Accurate computed tomography‐based portal pressure assessment in patients with hepatocellular carcinoma. J Hepatol. 2014;60(5):969–74. 10.1016/j.jhep.2013.12.015 [DOI] [PubMed] [Google Scholar]
- 26. Yan SP, Wu H, Wang GC, Chen Y, Zhang CQ, Zhu Q. A new model combining the liver/spleen volume ratio and classification of varices predicts HVPG in hepatitis B patients with cirrhosis. Eur J Gastroenterol Hepatol. 2015;27(3):335–43. 10.1097/meg.0000000000000269 [DOI] [PubMed] [Google Scholar]
- 27. Calvaruso V, Burroughs AK, Standish R, Manousou P, Grillo F, Leandro G, et al. Computer‐assisted image analysis of liver collagen: relationship to Ishak scoring and hepatic venous pressure gradient. Hepatology. 2009;49(4):1236–44. 10.1002/hep.22745 [DOI] [PubMed] [Google Scholar]
- 28. Bedossa P, Dargere D, Paradis V. Sampling variability of liver fibrosis in chronic hepatitis C. Hepatology. 2003;38(6):1449–57. 10.1053/jhep.2003.09022 [DOI] [PubMed] [Google Scholar]
- 29. Hall AR, Tsochatzis E, Morris R, Burroughs AK, Dhillon AP. Sample size requirement for digital image analysis of collagen proportionate area in cirrhotic livers. Histopathology. 2013;62(3):421–30. 10.1111/his.12010 [DOI] [PubMed] [Google Scholar]
- 30. Galilei G. Dialogues concerning two new sciences [Internet]. Dover. https://books.google.es/books?id=BvyG03NrbC8C [Google Scholar]
- 31. Ripoll C, Bañares R, Rincón D, Catalina MV, Lo Iacono O, Salcedo M, et al. Influence of hepatic venous pressure gradient on the prediction of survival of patients with cirrhosis in the MELD Era. Hepatology. 2005;42(4):793–801. 10.1002/hep.20871 [DOI] [PubMed] [Google Scholar]
- 32. Hayashi T, Saitoh S, Fukuzawa K, Tsuji Y, Takahashi J, Kawamura Y, et al. Noninvasive assessment of advanced fibrosis based on hepatic volume in patients with nonalcoholic fatty liver disease. Gut Liver. 2017;11(5):674–83. 10.5009/gnl16440 [DOI] [PMC free article] [PubMed] [Google Scholar]
- 33. Tan KC. The right posterior hepatic notch sign. Radiology. 2008;248(1):317–8. 10.1148/radiol.2481051024 [DOI] [PubMed] [Google Scholar]
- 34. Papatheodoridi M, Hall AR, Rodriguez‐Peralvarez M, Pieri G, Germani G, Gale JD, et al. Histological sub‐classification of cirrhosis using collagen proportionate area in patients with chronic hepatitis C. Liver Int. 2021;41(7):1608–13. 10.1111/liv.14909 [DOI] [PubMed] [Google Scholar]
- 35. Turco L, Garcia‐Tsao G, Magnani I, Bianchini M, Costetti M, Caporali C, et al. Cardiopulmonary hemodynamics and C‐reactive protein as prognostic indicators in compensated and decompensated cirrhosis. J Hepatol. 2018;68(5):949–58. 10.1016/j.jhep.2017.12.027 [DOI] [PubMed] [Google Scholar]
- 36. Younossi ZM, Koenig AB, Abdelatif D, Fazel Y, Henry L, Wymer M. Global epidemiology of nonalcoholic fatty liver disease‐Meta‐analytic assessment of prevalence, incidence, and outcomes. Hepatology. 2016;64(1):73–84. 10.1002/hep.28431 [DOI] [PubMed] [Google Scholar]
- 37. Vilar‐Gomez E, Calzadilla‐Bertot L, Wai‐Sun Wong V, Castellanos M, Aller‐de la Fuente R, Metwally M, et al. Fibrosis severity as a determinant of cause‐specific mortality in patients with advanced nonalcoholic fatty liver disease: a multi‐national cohort study. Gastroenterology. 2018;155(2):443–57.e17. 10.1053/j.gastro.2018.04.034 [DOI] [PubMed] [Google Scholar]
Associated Data
This section collects any data citations, data availability statements, or supplementary materials included in this article.
Supplementary Materials
Supplementary Figure S1
Supplementary Figure S2
Supplementary Figure S3
Supplementary Figure S4
Supplementary Figure S5
Supplementary Figure S6
Supplementary Table S1
Supplementary Table S2
Supplementary Table S3
Supplementary Table S4
Supplementary Table S5
Supplementary Table S6
Data Availability Statement
Data generated or analysed during the study are available from the corresponding author by request.