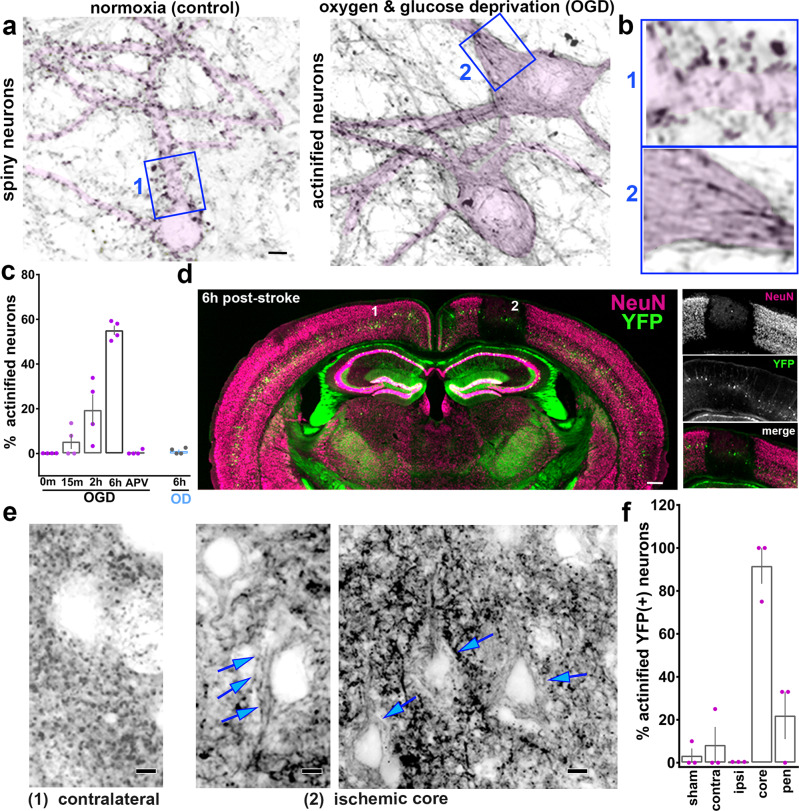
Fig. 1. Ischemia-induced actin filament reorganization.
a Cultured rat hippocampal neurons stained using Alexa-Fluor-647-phalloidin in the absence or presence of oxygen and glucose deprivation (OGD). Selected inverted grayscale somatodendritic regions are highlighted in pink. Note: in control F-actin is concentrated in dendritic spines (dark puncta), while OGD induces a decrease in spine F-actin and an accumulation of linear bundles of F-actin within the soma and dendrite of many neurons (actinification). Scale bar, 5 µm. b Numbered insets correspond to blue boxed regions in a. Width blue boxes = 17 µm. c Quantification of the fraction of actinified neurons in control vs OGD or OD (oxygen deprivation) for the indicated durations; the NMDA receptor antagonist APV prevented actinification seen with 6 h OGD. n = 4 independent experiments; Kruskal–Wallis one-way ANOVA (p = 0.0066), with Dunn’s post hoc multiple comparison analysis (p = 0.0421 OGD 0 m vs 6 h; p = 0.0149 OGD 6 h vs APV). d Coronal brain section of a Thy1-YFP (green) expressing mouse stained for the neuronal cell body marker NeuN (magenta) 6 h post stroke. Regions marked “1” and “2”: areas from which the corresponding enlarged images in e are shown (below). Scale bar, 350 µm. Right: Higher magnification of the individual fluorescent labels of the ischemic area. e Alexa-Fluor-647-Phalloidin staining of neurons within somatosensory cortex within (2) infarcted region (middle, right panels at different magnification), or (1) corresponding region contralateral to the stroke (left single panel). Blue arrows: accumulation of linear actin bundles within the somatodendritic region of YFP-positive neurons. F-actin staining within the control, contralateral region (left) exhibits the punctate pattern of dendritic spines. Scale bars, 5 µm (left and middle), 8 µm (right). f Quantification of the fraction of YFP-positive layer 5/6 neurons exhibiting actinification under the following conditions and regions: sham-operated mice (somatosensory cortex); or stroke-induced mice within the contralateral cortex, ipsilateral cortex, the ischemic core, or the penumbra.; n = 3 biologically independent animals each, sham vs stroke; one-way ANOVA (p = 0.0001), with Tukey’s post hoc multiple comparison analysis (p = 0.0001 sham vs core; p = 0.0004 core vs pen). All graphs: data presented as mean ± SEM. Source data are provided as source data file.

