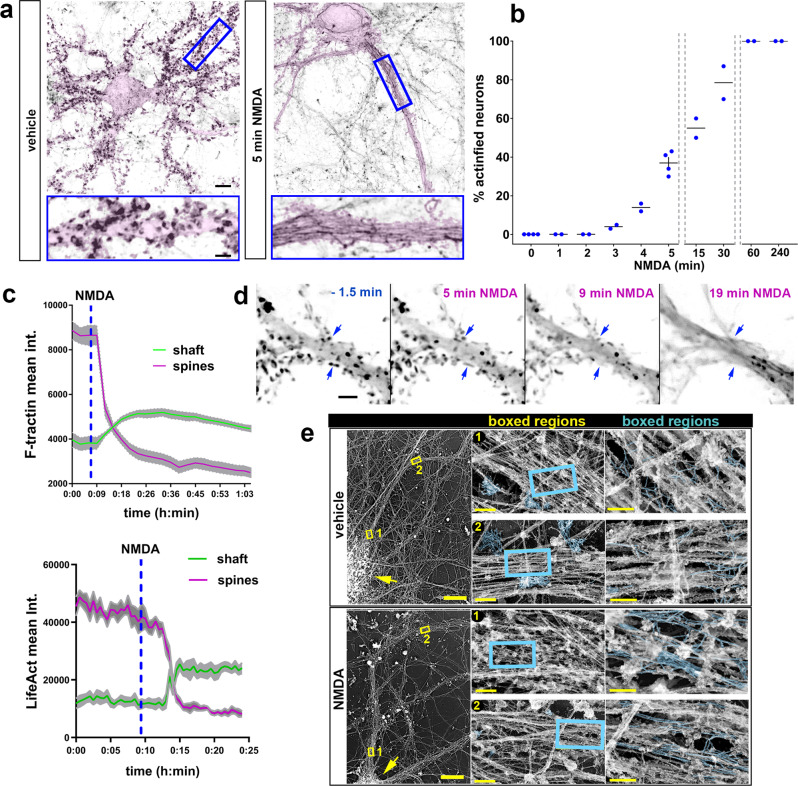
Fig. 2. Rapid actinification induced by sub-lethal hyperactivation of NMDA receptors: time course and ultrastructure.
a Neurons expressing membrane-tagged GFP, to emphasize morphology (pink highlight), and stained with Alexa-Fluor-647-phalloidin to monitor F-actin (reverse grayscale). Neurons fixed after 5 min incubation with vehicle (left) or with 50 μM NMDA (right). Insets below show enlarged regions boxed in. Scale bars, 8 µm (above); 2.8 µm (below). b Time course of actinification; n = 4 independent experiments for 0 and 5 min; n = 2 independent experiments for all the other time points. c Examples of two representative time courses where either mApple-F-tractin or Lifeact-mRFP intensity were monitored over time in an individual dendrite shaft (green line) vs the adjacent spines (magenta line) during NMDA-induced actinification. Plotted lines represent mean ± SEM from regions of interest (ROIs) taken across different portions of the same dendrite and different spines of a single neuron. d Time-lapse montage of a dendritic region expressing Lifeact-mRFP at selected time points before and after exposure to NMDA. Scale bar, 5 µm. Blue arrows: examples of spine F-actin decreasing as the F-actin signal in the shaft increases. e Hippocampal cultures incubated for 30 min in vehicle or NMDA, prior to processing for platinum replica electron microscopy (PREM). A neuron representative of each condition is shown at left; yellow arrows: cell soma; yellow boxes: two regions of the dendrite that are displayed at 70× higher magnification in the middle panels, and at a further 3× higher magnification in the right panels. Actin filaments are highlighted (cyan). In control (vehicle), numerous clusters of short, branched actin filaments are observed in presumptive dendritic spines, with occasional actin filaments within the dendrite shaft. After NMDA spine-like protrusions substantially decreased, and numerous long, unbranched filaments were detected within the dendritic shaft (cyan labeled structures within boxed regions). Scale bars, 20 µm for left panels, 500 nm for middle panels, and 200 nm for right panels. All graphs: data presented as mean ± SEM, and source data are provided as source data file.

