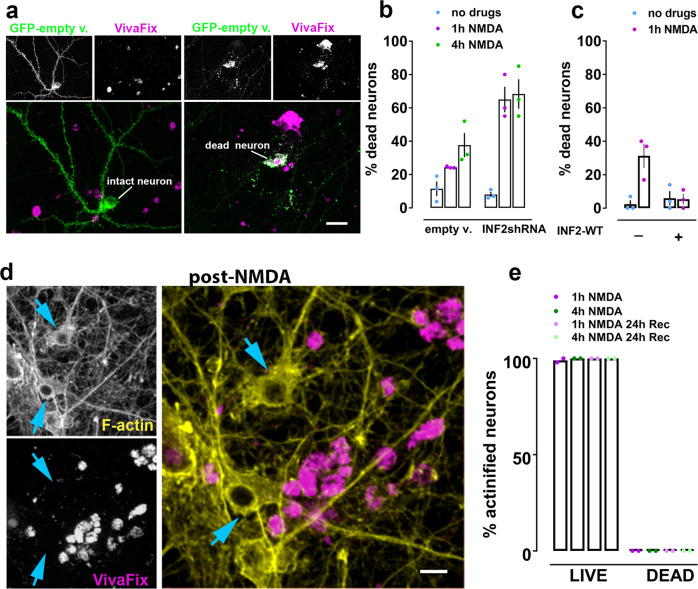
Fig. 6. INF2 silencing enhances NMDA-induced neuronal cell death.
Neurons expressing either control empty vector or its corresponding INF2-shRNA were incubated with or without NMDA prior to fixation and co-staining with Alexa-fluor-568-phalloidin and VivaFix 649/660. a Representative images of dead neurons (incorporating VivaFix) vs live neurons (excluding VivaFix, magenta). GFP-empty vector (green) was used as cytoplasmic filler to evaluate integrity of neuronal morphology (i.e., intact vs fragmented). Scale bars, 28 µm. b INF2 silencing increases cell death. n = 3 independent experiments; two-way ANOVA [empty v. vs INF2shRNA, F (1, 12) = 21.94; p = 0.0005; +/− NMDA (1 h, 4 h), F (2, 12) = 30.12; p = 0.0001], with Tukey’s post hoc multiple comparison analysis (n.s. p = 0.998, no drugs +/− INF2shRNA; p = 0.004, 1 h NMDA +/− INF2shRNA; p = 0.0298, 4 h NMDA +/− INF2shRNA). c Over-expression of wildtype INF2 (GFP-INF2WT) prevents NMDA-induced cell death. n = 3 independent experiments; two-way ANOVA [+/− INF2WT, F (1, 8) = 5.868; p = 0.0417; +/− NMDA (1 h), F (1, 8) = 9.444; p = 0.0153], with Tukey’s post hoc multiple comparison analysis (p = 0.0092, no INF2WT +/− NMDA; n.s. p = 0.9996, INF2WT +/− NMDA). d Neurons incubated for 1 h with NMDA and fixed immediately, illustrating that actinified neurons (yellow = phalloidin) do not take up VivaFix (magenta). Scale bars, 14 µm. e Quantification of live vs dead fraction of actinified neurons among neurons transfected with empty vector revealed a binary fate for stressed neurons. Actinified neurons always excluded VivaFix dye; neurons taking up VivaFix dye were never actinified, whether fixed immediately after the indicated NMDA incubation time, or after an “imposed recover period” where a cocktail of NMDAR blockers was added to prevent ongoing excitotoxicity. n = 2 independent experiments; two-way ANOVA [Live vs Dead, F (1, 8) = 159041; p = 0.0001; NMDA conditions, F (3, 8) = 0.88; n.s. p = 0.4911]. All graphs: data presented as mean ± SEM, and source data are provided as source data file.

