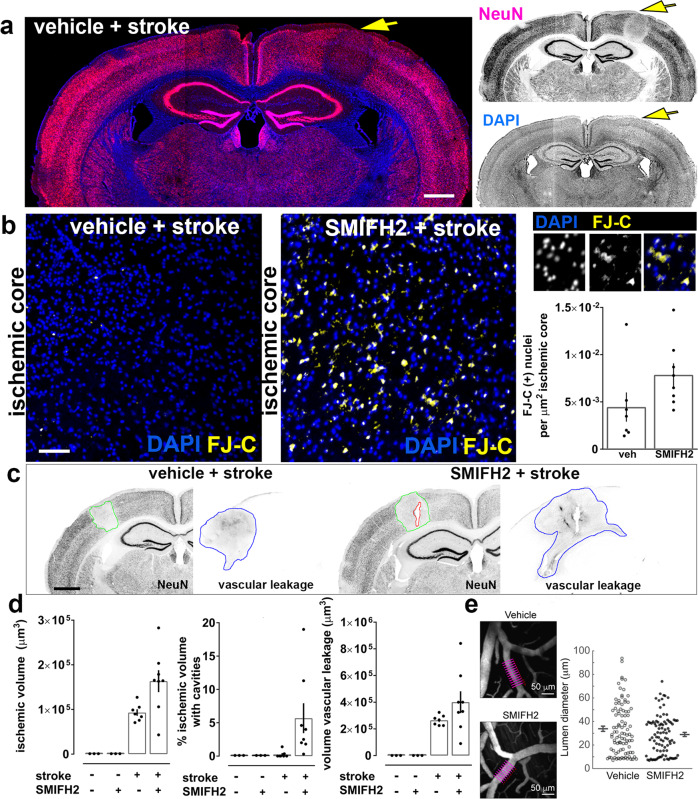
Fig. 7. Formin inhibition enhances stroke-induced cell death in vivo.
a Coronal mouse brain section showing reduced NeuN immunoreactivity within the infarct region (yellow arrow) 4 h post-stroke. Scale bar, 850 µm. b SMIFH2 increases early cell death as shown in representative regions of cortical ischemic core. Enlarged panels at right illustrate somatic FluoroJade-C (FJ-C) colocalization with nuclear DAPI staining. Quantification of the density of FJ-C-positive (+) soma within the ischemic core region. n = 7 animals (veh + stroke); n = 8 animals (SMIFH2 + stroke); Mann–Whitney test, two-tailed p = 0.0401; Scale bar: 70 µm. c Images of brain sections stained for the neuronal marker NeuN and for IgG to assess vascular leakage following stroke. Scale bars, 800 µm. d Quantification of infarct volume (based on NeuN signal loss), fraction of ischemic volume containing cavitations (holes in the brain parenchema), and vascular leakage (based on volume of IgG signal). n = 3 animals (veh./no stroke), n = 3 animals (SMIFH2/no stroke), n = 7 animals (veh + stroke), n = 8 animals (SMIFH2 + stroke). Ischemic volume: Kruskal–Wallis one-way ANOVA (p = 0.0015), with Dunn’s post hoc multiple comparison analysis (p = 0.0105 veh no stroke vs SMIFH2 stroke; p = 0.0105 SMIFH2 no stroke vs SMIFH2 stroke; n.s. vehicle stroke vs SMIFH2 stroke). Percentage of ischemic volume with cavities: Kruskal–Wallis one-way ANOVA (p = 0.0027). Volume vascular leakage: Kruskal–Wallis one-way ANOVA (p = 0.0005), with Dunn’s post hoc multiple comparison analysis (p = 0.0152 veh no stroke vs SMIFH2 stroke). e (Left) Representative in vivo two-photon imaging of cortical pial vessels from vehicle-treated (upper) and SMIFH2-treated (lower) mice. Purple lines denote the position of diameter measurements of a pial arteriole, averaged to provide a single data point. Scale bars, 50 µm. (Right) Scatter plot of pial arteriole diameters from vehicle and SMIFH2-treated groups, including 93 arterioles over 6 vehicle-treated mice, and 90 arterioles over 7 SMIFH2-treated mice; mean and SEM are adjacent to each scatter plot; no significant differences were detected between groups (p = 0.2), statistical analysis performed by two-tailed Wilcoxon test. All graphs: data presented as mean ± SEM, and source data are provided as source data file.

