
Figure 4. Single-cell-level proportion and transcriptomic responses across the three tissues.
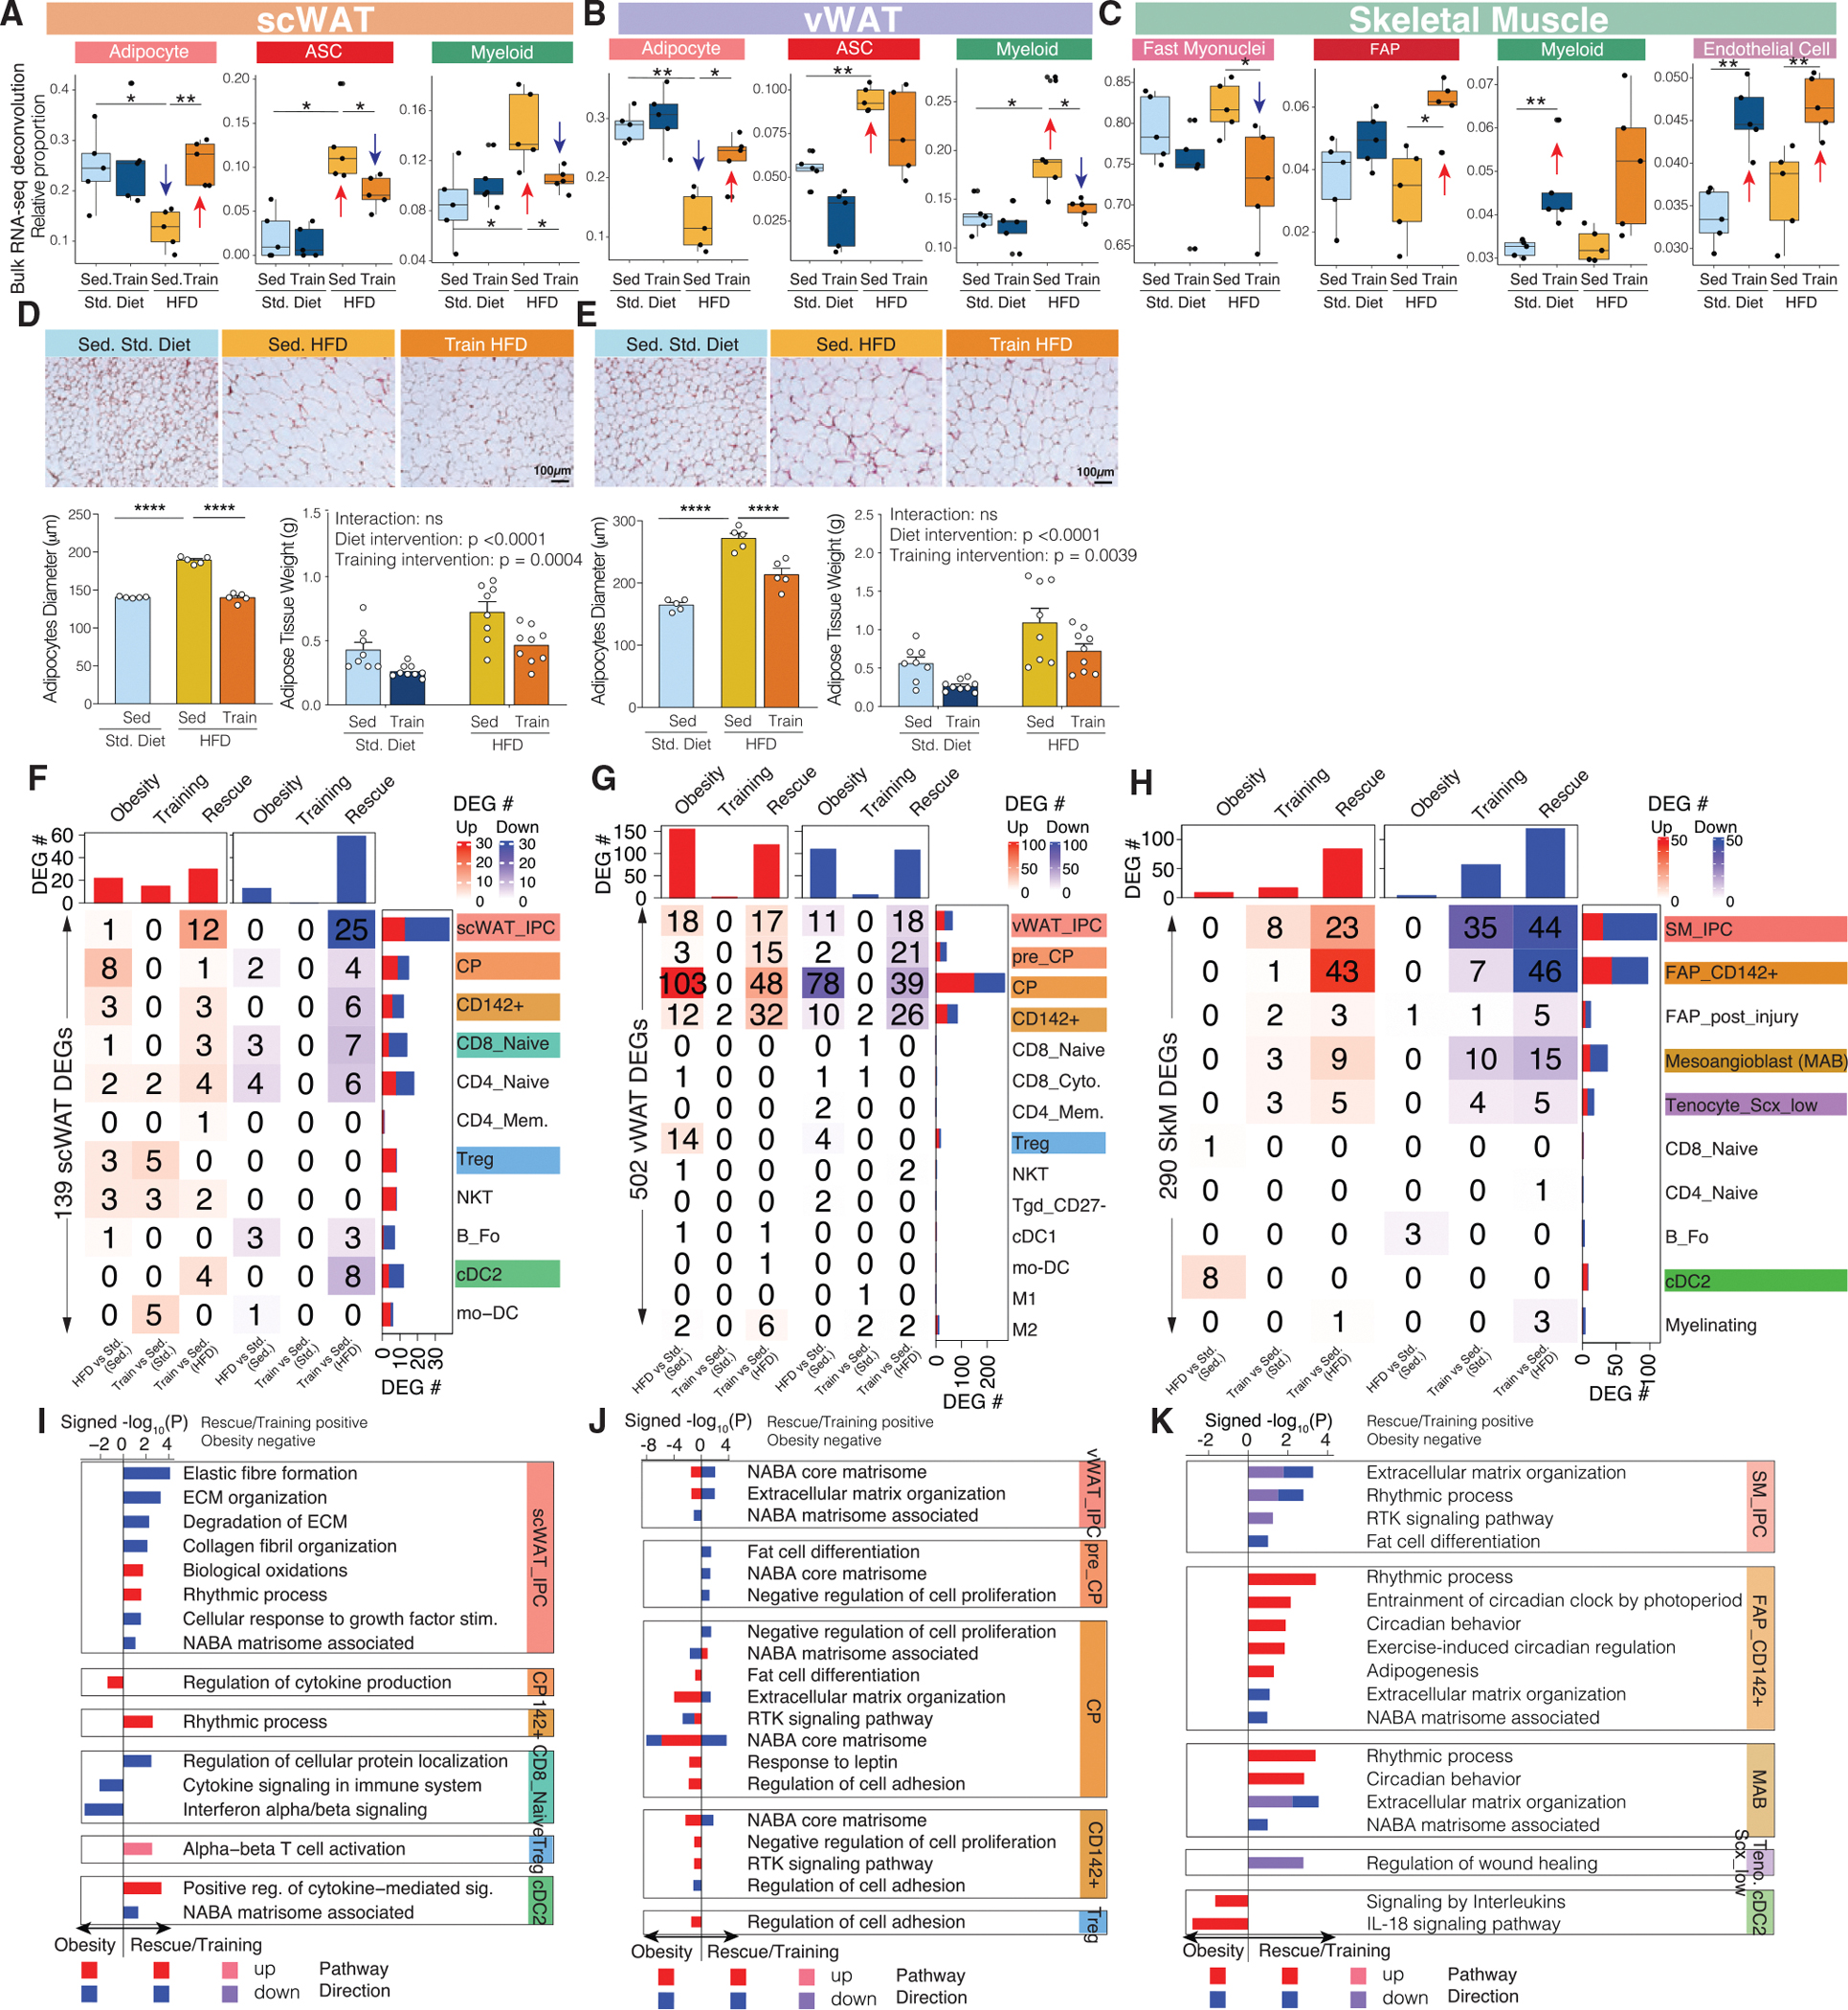
(A–C) Sample-specific proportions of cell types across the four intervention groups in scWAT (A), vWAT (B), and SkM (C) after bulk RNA-seq data deconvolution. The boxplots are defined as Q1 − 1.5*IQR, Q1, median, Q3, and Q3 + 1.5*IQR.
(D and E) Histology of scWAT (D) and vWAT (E) across three intervention groups, with bar plots below showing adipocyte diameter and adipose tissue weight changes across intervention groups.
(F–H) The number of cell-state-specific DEGs (heatmap) that are upregulated (red) or downregulated (blue) in our three comparisons in scWAT (F), vWAT (G), and SkM (H).
(I–K) Pathways (bar plot) that are significantly enriched in cell-state-specific DEGs across the three comparisons in scWAT (I), vWAT (J), and SkM (K). x axis of the bar plot shows −log10 p value with rescue/training pathways being positive and obesity being negative. The bars are colored by pathway direction in the three comparisons (red/pink, upregulated; blue/purple, downregulated).
*p < 0.05, **p < 0.01, ***p < 0.001, ****p < 0.0001 by Wilcoxon rank-sum test (A–C) or by two-way ANOVA followed by Tukey multiple comparison tests (D and E).
Data are represented as mean ± SEM (D and E).