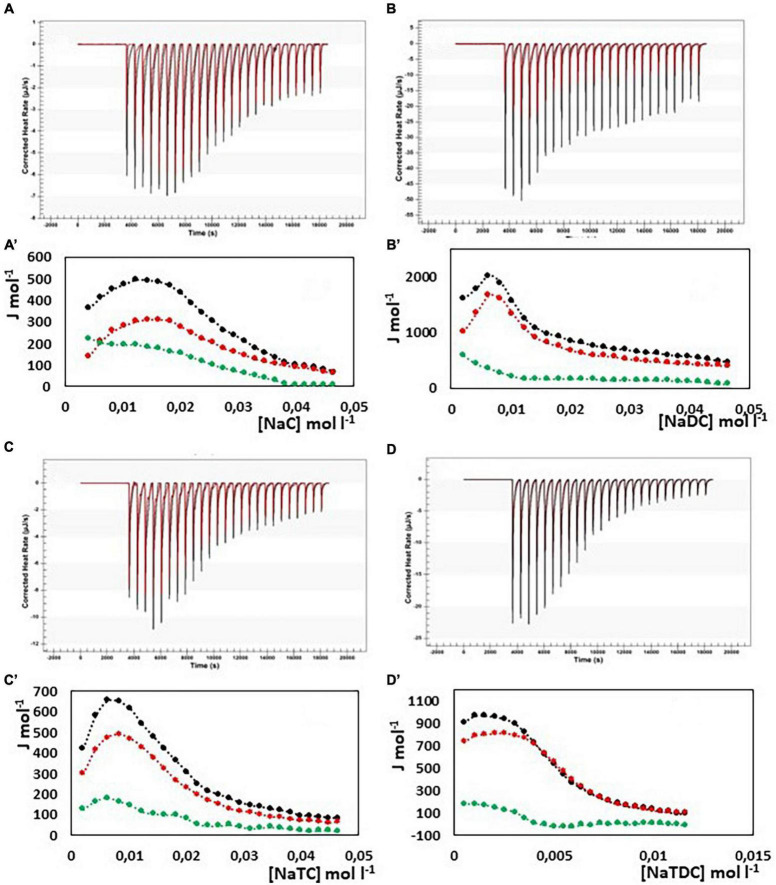
FIGURE 4.
Heat rate (μJ s–1) vs. time profiles obtained from 25 injection each of 10 μL into a 960 μL reaction cell filled with an alginate solution 1 g L–1 (black) compared with the dilution of bile salt (red) in the same conditions, and (specified by a single quote mark) the dependence of the enthalpy change vs. bile salt concentration in the reaction cell for: (A) NaC 200 mM; (B) NaDC 200 mM; (C) NaTC 200 mM; (D) NaTDC 50 mM. Black dots represent the interaction enthalpy between alginate and bile salt, the red dots the dilution enthalpies of bile salt and the green dots their difference.

