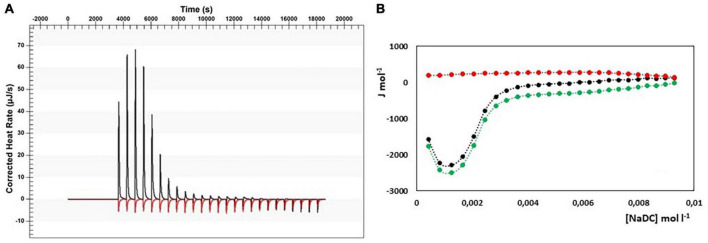
FIGURE 6.
(A) Heat rate (μJ s–1) vs. time profiles obtained from 25 injection each of 10 μL of NaDC 40 mM into a 960 μL reaction cell filled with a pectin solution 1 g L–1 (black) compared with the dilution of NaDC 40 mM (red); (B) the dependence of the enthalpy changes vs. NaDC concentration in the reaction cell. Black dots represent the interaction enthalpy between pectin and bile salt, the red dots the dilution enthalpies of bile salt and the green dots their difference.

