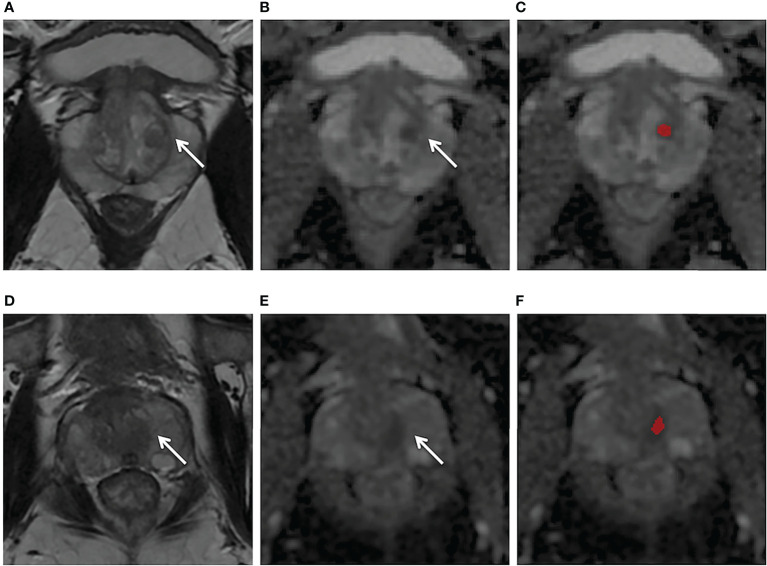
Figure 4.
(A–C) Axial MR images obtained in a 56-year-old patient with a PSA level of 4.2 ng/ml and with negative biopsy findings. T2WI (A) showed a heterogeneous encapsulated nodule in the left transition zone (arrow) and the ADC map (B) showed hypointensity (arrow). The ADC model (C) appeared false positive (red region). (D–F) Axial MR images obtained in a 64-year-old patient with a PSA level of 5.9 ng/ml and with negative biopsy findings. T2W (D) and ADC (E) showed a normal left central zone, while the ADC model (F) appeared false positive in this area (red mark). The biparametric model gave negative predictive values for both cases.

