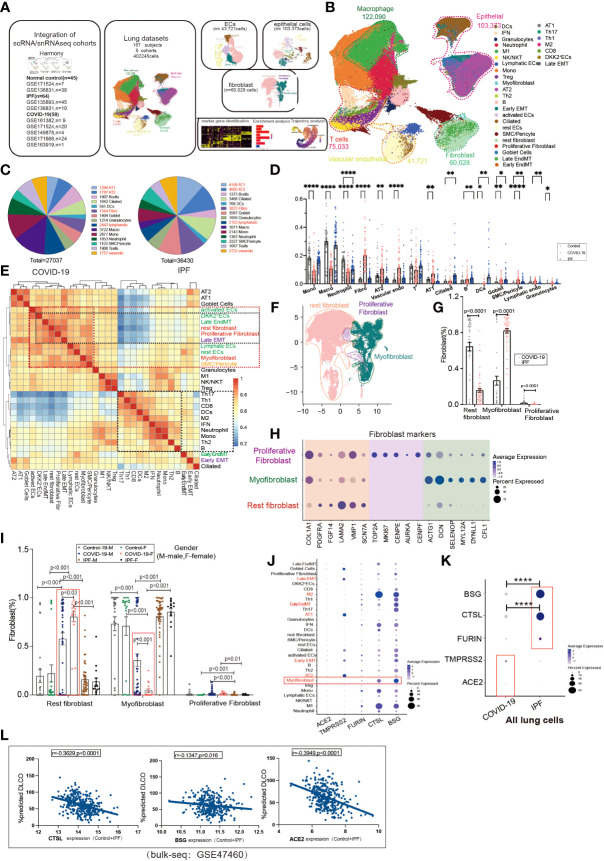
Figure 1.
Subpopulation correlation analysis suggested a strong correlation between MT subpopulation and fibroblast subpopulation. (A) Scheme of this study. (B) Demonstration of HC, COVID-19, and IPF subgroups using UMAP, including Endothelial (vascular endothelial: rest ECs, EndMT, DKK2+ ECs, activated ECs; Lymphatic ECs); Epithelial (AT2, AT1, Goblet Cell, EMT, Ciliated); Fibroblast (Proliferative Fibroblast, Myofibroblast, Rest fibroblast, Late EndMT, Late EMT); SMC/Pericyte; T cells (Th1, Th17, Th2, Treg, NK/NKT, CD8, IFN); Macrophage (M2, M1); Granulocytes; DCs; Mono; Neutrophil. And the proportion of cell subpopulations in HC, COVID-19, IPF. Marker genes: Endothelial cells:PECAM1, VWF, CLDN5; Macrophages: MARCO, MSR1, MRC1;T cells:CD3E, CD3D, GZMH; Granulocytes:MS4A2, CPA3, TPSAB1; B cells:MS4A1, BANK1, CD79A;Monocytes:CD14, FCN1; Neutrophil:S100A8, S100A9; Epithelial cells:EPCAM; Fibroblast:COL1A1, PDGFRA, ELN;SMC:SCGB1A1, RPL26). (C) Pie charts show the number of differentially expressed genes per cell type in COVID-19/IPF compared to controls. The DEGs of COVID-19 were mainly concentrated in macrophages and monocytes, and the DEGs of IPF were mainly concentrated in epithelium. (D) The proportion of cell subpopulations in HC, COVID-19, IPF. (E) The heat-map shows the correlation analysis for each cell subpopulation. The correlation between late-stage EMT, late-stage EndMT and fibroblast subpopulation was higher. (F) UMAP suggests a subpopulation distribution of fibroblasts, including Myofibroblas,Proliferative fibroblas and Rest fibroblast. (G) Ratio of fibroblast subpopulations in patients with COVID-19, IPF, showing myofibroblast ratio in IPF is higher than that in COVID-19, but Rest fibroblast ratio in IPF is lower than that in COVID-19. (H) Markers of fibroblast subpopulations, including Myofibroblast (ACTG1, DCN, SELENOP, MYL12A, DYNLL1, CFL1), Proliferative fibroblast (TOP2A, MKI67, CENPE, AUPKA, CENPF) and Rest fibroblast (COL1A1, PDGFRA, FGF14, LAMA2, VMP1, SCN7A). (I) The proportion of fibroblast subpopulations in COVID-19, IPF by female and male, showing Myofibroblast ratio in females is lower than that in males with COVID-19. (J) The DOT plot shows the expression of entry factors in subgroups of control, COVID-19, IPF. Subgroups including Rest fibroblast, Myofibroblast, Proliferative Fibroblast, Late EndMT, Late EMT, SMC/Pericyte; rest ECs, DKK2+ ECs, activated ECs, Lymphatic ECs, EndMT-early; AT1, AT2, Ciliated, Early EMT, Goblet Cell; Granulocytes; B, Th2, Th1, Th17, Treg, CD8, Mono, M1, M2, Neutrophil, DCs, NK/NKT. (K) The DOT plot shows the expression of entry factors in COVID-19, IPF. (L) Correlation analysis of entry factors (CTSL, BSG, ACE2) and lung function test (%predicted DLCO) showed that lung function was negatively correlated with the normalized bulk RNA-seq gene expression of the entry factors. *P < 0.05, **P < 0.01,**** P< 0.0001.

