Figure 5.
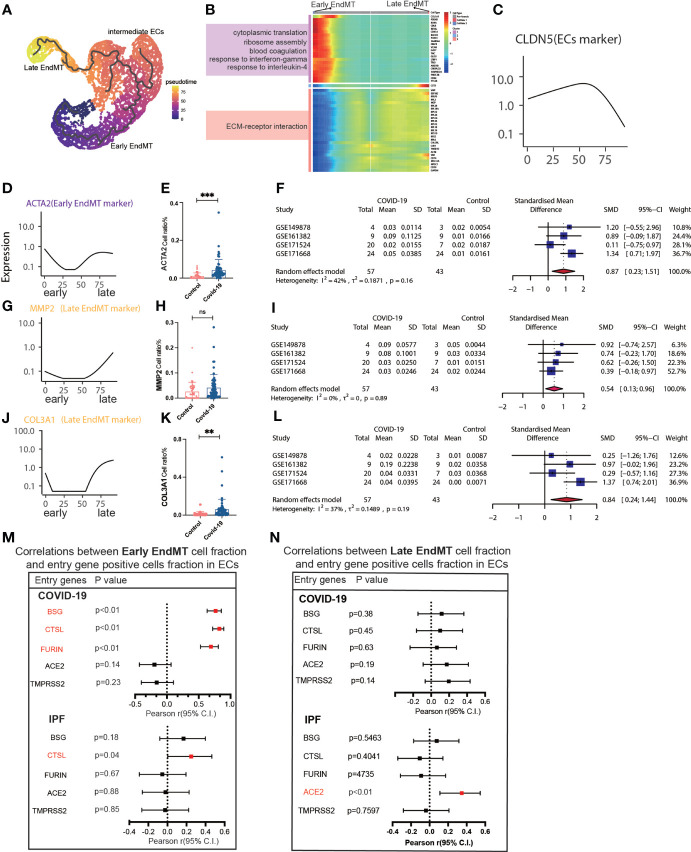
Characteristics of early and late stage EndMT. (A) Pseudotime projection analysis showing early-stage EndMT could evolve to late-stage EndMT. (B) Single cell proposed time branch point analysis showing genes with progressively lower and higher expression from Early EndMT to Late EndMT. Each row of the heat map on the right represents a gene, each column is a proposed time point, and the color represents the average expression value of the gene at the current time point, with the color decreasing from red to blue. The left side shows the signaling pathways that the gene set is enriched to. (C) The proposed time trajectory of a single gene, showing the change in gene expression of the ECs marker gene (CLDN5) from the beginning to the end of the proposed time course. (D) Trajectories of individual genes, showing changes in gene expression of Early EndMT marker genes (ACTA2) from the beginning to the end of the proposed time course. (E) ACTA2 gene positive ECs ratio is higher in COVID-19 than that in HC. (F) Forest plot of studies with ACTA2 gene positive ECs ratio on the COVID-19 and HC, after excluding a study with only one case. The analysis included data from 4 studies with a total of 57 COVID-19 and 43 controls. p value for heterogeneity was 0.16, I2 was 42%. (G) Temporal trajectories of individual genes showing changes in gene expression of Late EndMT marker gene (MMP2) from the beginning to the end of the proposed time course. (H) MMP2 gene positive ECs ratio is higher in COVID-19 than that in HC. (I) Forest plot of studies with MMP2 gene positive ECs ratio on the COVID-19 and HC, after excluding a study with only one case. The analysis included data from 4 studies with a total of 57 COVID-19 and 43 controls. p value for heterogeneity was 0.89, I2 was 0%. (J) Trajectories of individual genes showing changes in gene expression of the Late EndMT marker gene (COL3A1) from the beginning to the end of the proposed time course. (K) COL3A1 gene positive ECs ratio is higher in COVID-19 than that in HC. (L) Forest plot of studies with COL3A1 gene positive ECs ratio on the COVID-19 and HC, after excluding a study with only one case. The analysis included data from 4 studies with a total of 57 COVID-19 and 43 controls. p value for heterogeneity was 0.19, I2 was 37%. (M) Forest plot showing the correlation between Early EndMT cell fraction and entry gene positive cells fraction in ECs. Entry factors (BSG, FURIN, CTSL) was positively correlated with the expression of Early EndMT in COVID-19 (p < 0.05, Pearson’s r > 0). CTSL was positively correlated with the expression of Early EndMT in IPF (p < 0.05, Pearson’s r > 0). (N) Forest plot showing the correlation between Late EndMT cell fraction and entry gene positive cells fraction in ECs. Entry factors (ACE2) was positively correlated with the expression of Late EndMT in COVID-19 (p < 0.05, Pearson’s r > 0). **P < 0.01, ***P < 0.001; NS, P > 0.05.

