Figure 4.
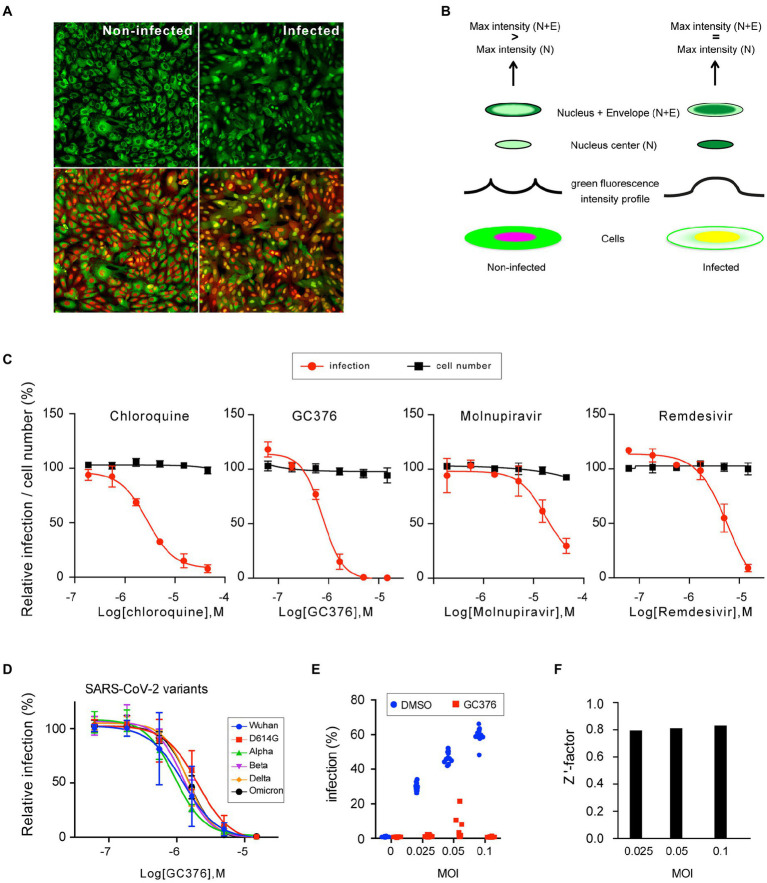
Characterization of the F1G-red reporter cell line in high-throughput format. (A) Images of individual fields of non-infected (left) and infected (right) F1G-red cells in 384-well plate format acquired using an InCell-6500 automated confocal microscope. The same fields are shown with GFP signal only (top) or with combined fluorescent signals (bottom). (B) Principle of automated quantification of SARS-CoV-2 infection. Cells are depicted with green and red signals, spatially separated in non-infected cells or combined in infected cells. The fluorescent intensity profile of GFP along an axis through the nucleus is schematically depicted above both cells. Above the intensity profiles, the pattern of green fluorescence in two areas, corresponding to the center of the nucleus (N) or to the nucleus and a ring of cytoplasm containing the nuclear envelope (N + E), are shown. Criteria for scoring infection versus non-infection are indicated on the top. (C) Antiviral dose–response experiments. F1G-red cells were infected with SARS-CoV-2 in the presence of indicated antivirals in 384-well plates and infection was measured at 16 hpi as explained in (B). Relative infection rates (red line) and cell numbers (black line) normalized to DMSO controls are plotted (mean ± SEM of 3 (chloroquine and GC376) or 2 (remdesivir and molnupiravir) independent experiments). (D) GC376 dose–response experiments using the indicated SARS-CoV-2 variants of concern using F1G-red cells in 384-well plate format (mean ± SEM of 3 independent experiments). (E) F1G-red cells were infected with SARS-CoV-2 at different MOI in the presence of 10 μM GC376 or 0.1% DMSO in 384-well plates and infection was measured at 16 hpi as explained in (B). Individual values corresponding to 12 independent wells are plotted for each condition. (F) A robust Z’ factor based on the median of each series of measurements shown in (E) was calculated for each MOI.

