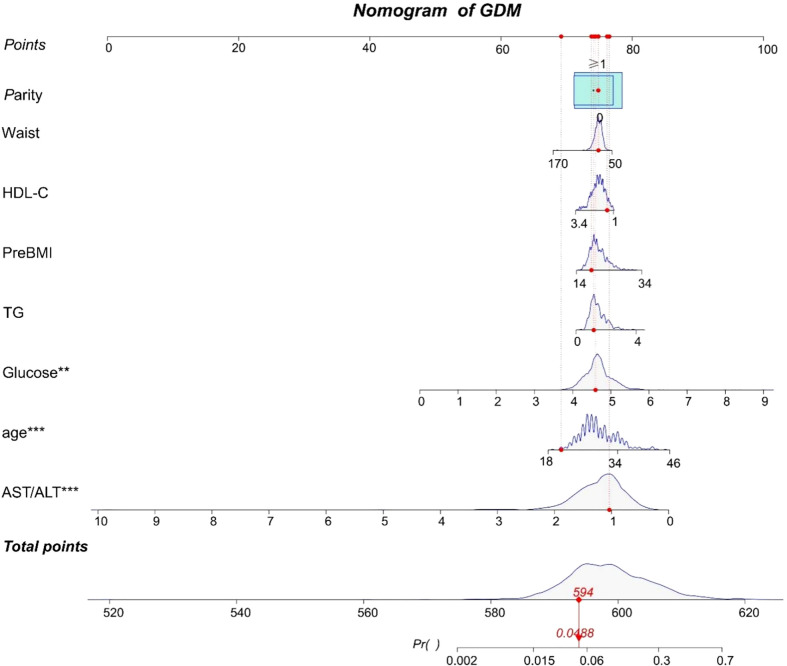
Figure 1.
A nomogram to predict for the risk of GDM. Scores are calculated by aligning the dots on each numbered row with the dots of the”Points” row. The total score is obtained by adding up all the scores and plotted on the “Total points” line. The difference in the relative proportion of patients in parity (0, ≥1) is represented by the rectangular area. Participant 1 in our study is listed as an example (expressed in red). Her total score was 594, which indicating that her probability of GDM was 4.88%. **P value < 0.01 and ***P value < 0.0001.

