Figure 4.
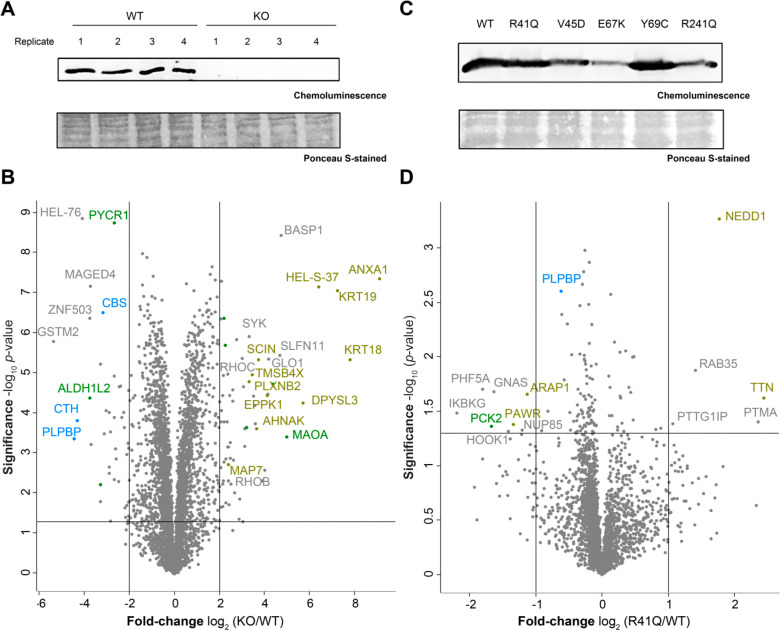
Proteomic changes upon PLPBP KO and mutant expression in HEK293. (A) Western blot analysis of PLPBP KO and WT cells using an anti-PLPBP antibody. (B) Volcano plot representing t-test results of HEK293 PLPBP KO cells compared to HEK293 wild type control cells (n = 4 biological replicates). Cutoff values were defined as enrichment factor of log2(KO/WT) = 2 (4-fold enrichment) or depletion factor of log2(KO/WT) = −2 (4-fold depletion) and −log10(p-value) = 1.3 (solid lines). Dysregulated mitochondrial proteins are highlighted in green, PLP-DEs in blue, and proteins connected to the cytoskeleton in ocher. (C) Western blot analysis of transfection of PLPBP WT and mutants into HEK293 PLPBP KO cells using an anti-FLAG antibody. (D) Volcano plot representing t-test results of overexpression of the R41Q mutant compared to overexpression of the WT in PLPBP KO cells (n = 4 biological replicates). Cutoff values were defined as enrichment factor of log2(R41Q/WT) = 1 (2-fold enrichment) or depletion factor of log2(R41Q/WT) = −1 (2-fold depletion) and −log10(p-value) = 1.3 (solid lines). Dysregulated mitochondrial proteins are highlighted in green, PLP-DEs in blue, and proteins connected to the cytoskeleton in ocher.

