
Figure 4.
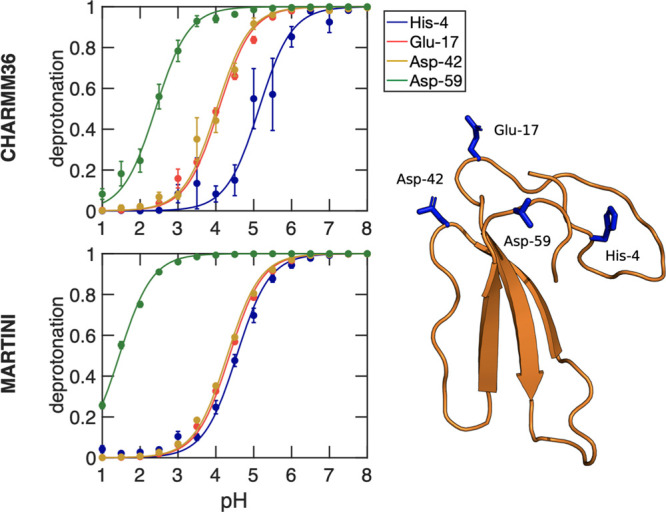
Titration curves of the cardiotoxin V protein obtained from constant pH MD simulations with the CHARMM36 (top) and Martini 2.0 force fields (bottom). For each of the four titratable residues in this protein, the dots show the fraction of frames in which the residue is deprotonated. Errors of Sdeprot were estimated from the standard error of the mean for the different replicas. The lines show the best fits to the Henderson–Hasselbalch equation. The pKa values for each titratable residue were estimated from these fits and listed in Table 1. The right panel shows the protein structure with the four titratable residues highlighted in stick representation.