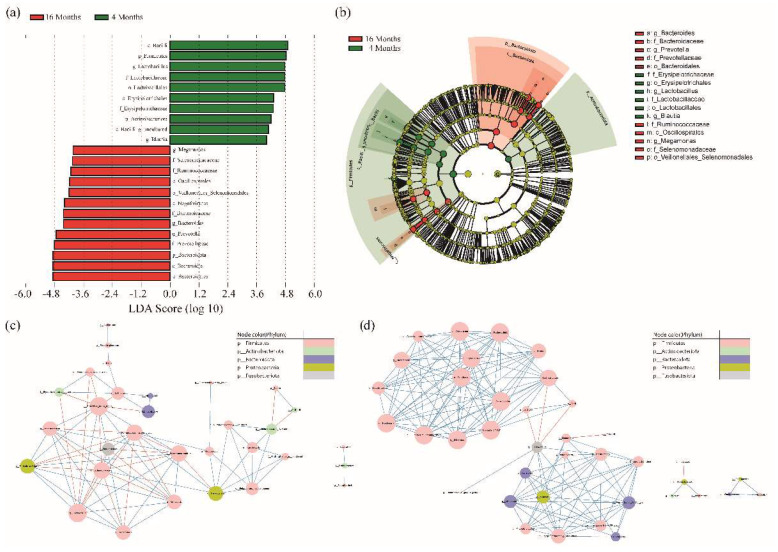
Figure 2.
(a) To identify the significantly different abundant taxa between the 4 and 16−month−old groups, we used the LEfSe method. Statistically significant groups were reported with linear discriminant analysis (LDA) scores > 4. (b) The cladogram showed the taxonomic distribution of bacterial groups (green; 4−month−old, red; 16−month−old). (c,d) shows the Pearson correlation network of the gut microbiome genera. Each node represents a genus and the node size represents the number of related edge numbers. Blue and red edges indicate positive and negative associations between nodes, respectively. The node color indicates a phylum (coefficient value > |0.8|, shown in Supplementary Table S3).

