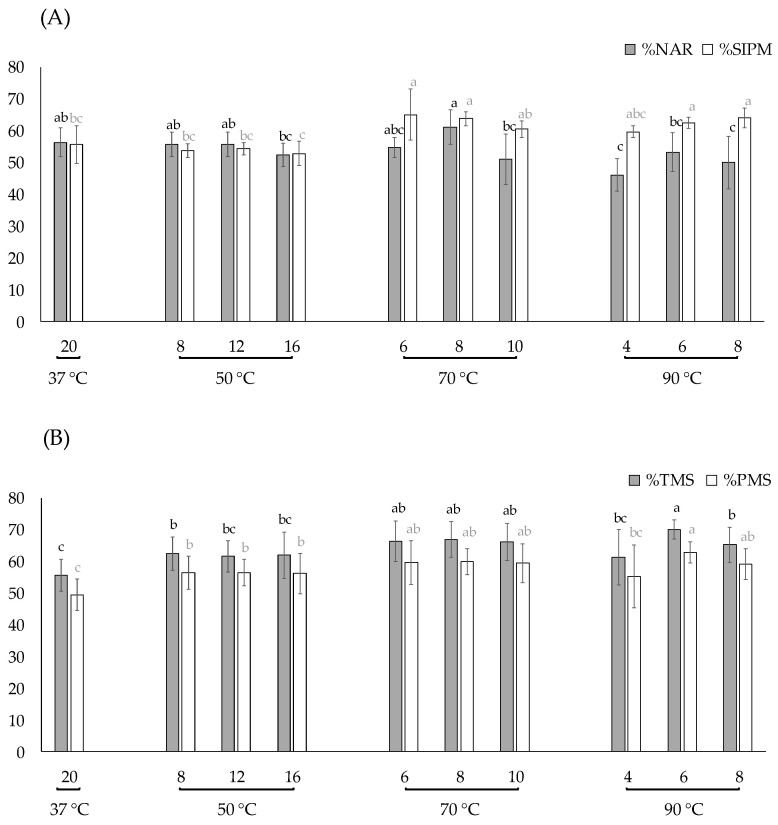
Figure 4.
Evaluation of different thawing conditions. Data are expressed as mean ± standard deviation. (A) Effect on normal acrosomal ridge (%NAR) and sperm with intact plasma membrane (%SIPM); a, b, c Indicate significant differences between treatments (p < 0.05); black letters are within %NAR and grey letters within %SIPM. (B) Effect on total motile sperm (%TMS) and progressive motility sperm (%PMS); a, b, c Indicate significant differences between treatments (p < 0.05); black letters are within %TMS and grey letters within %PMS.

