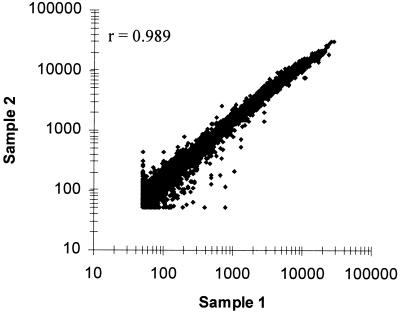
FIG. 2.
Comparison of transcript levels from duplicate bacterial cultures. A scatter plot of average intensity difference values from a hybridization experiment with cDNA prepared from duplicate cultures of B. subtilis PY79 grown to exponential growth phase in minimal medium is shown. Average intensity differences from 50 to >20,000 U are plotted. r is the Pearson correlation coefficient.

