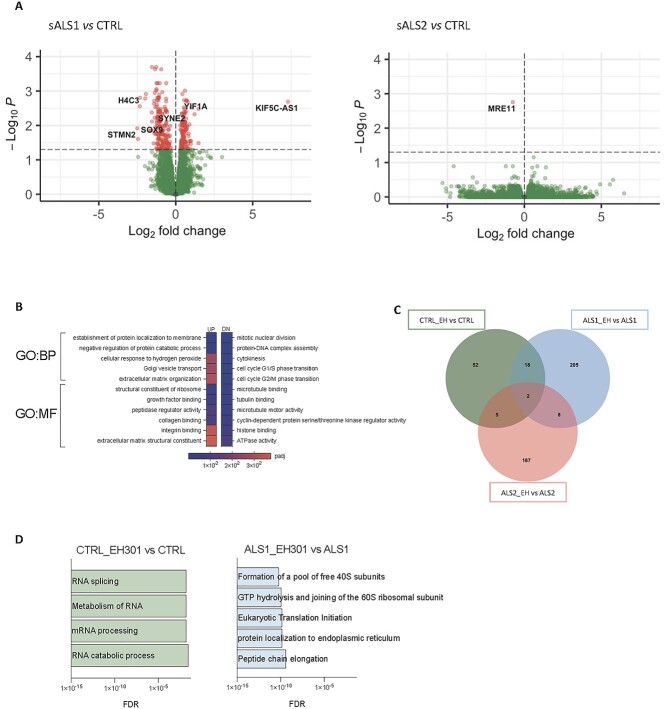
Figure 1.
Different sALS metabotypes show distinct gene expression profiles and transcriptional responses to EH301. (A) Volcano plot of DEGs in sALS1 (left) versus control and sALS2 (right) versus control fibroblasts (n = 6 per group). Red dots represent DEGs with P-value < 0.05 after FDR adjustment. Known ALS-related disease genes are labeled. (B) Gene ontology pathways with significantly enriched BPs and MFs of upregulated and downregulated DEGs in sALS1compared to control. (C) Venn diagram of DEGs with P-value < 0.05 after FDR adjustment modified by EH301 in control (green), sALS1 (blue) and sALS2 (red) fibroblasts (n = 6 per group). (D) Gene ontology pathways significantly enriched in EH301 treated controls (green) and sALS1 (blue) fibroblasts, (n = 6 per group), all DEGs with P-value < 0.05 after FDR adjustment were included in the analysis.

