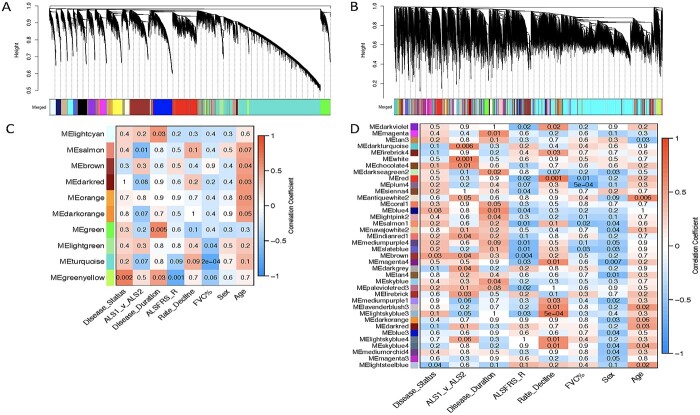
Figure 3.
EH301 modifies network structure and associations of modules with disease traits. (A, B) Dendogram of hierarchical clustering of gene co-expression dissimilarity values, constructed from the TOM, for vehicle-treated samples (A) and EH301-treated samples (B). Colors correspond to module assignments (see Supplementary Material Fig. S1 for network construction parameters). (C, D) Heatmaps showing correlations between module eigengene expression values and clinical traits for vehicle-treated samples (C) and EH301-treated samples (D). The numbers in each box are P-values, while box colors correspond to the correlation coefficient. For clarity, only modules with at least 1 significant trait association are shown.

