Figure 7.
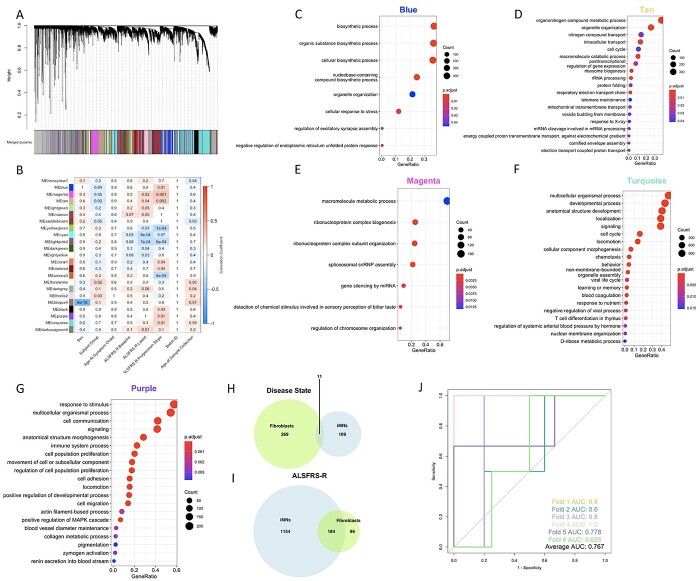
WGCNA of transcriptomic data from iMNs confirms the association of several GO pathways with disease traits found in fibroblasts. (A) Dendogram of hierarchical clustering of gene co-expression dissimilarity values, constructed from the TOM, for all iMN samples (n = 124). Colors correspond to module assignments. (B) Heatmap showing correlations between module eigengene expression values and clinical traits. The numbers in each box are P-values, while box colors correspond to the correlation coefficient. For clarity, only modules with at least 1 significant trait association are shown. (C–G) Top 20 most significant non-redundant GO: BP terms (identified using the simplify function from the clusterProfiler package to merge terms with more than 40% overlapping annotated genes) terms enriched in the Blue (C), Tan (D), Magenta (E), Turquoise (F) and Purple (G) modules. (H, I) Venn diagram showing overlap of all significantly enriched GO terms from all modules associated with disease status (H) or ALSFRS-R (I) in the iMN and vehicle fibroblast networks. (J) ROC curves for each of the six cross-validation runs of the classification model (trained and tested on the 62 iMN samples with ALFRS-R progression data) with computable ROC. AUC values for each curve indicated on bottom right.

