Figure 2.
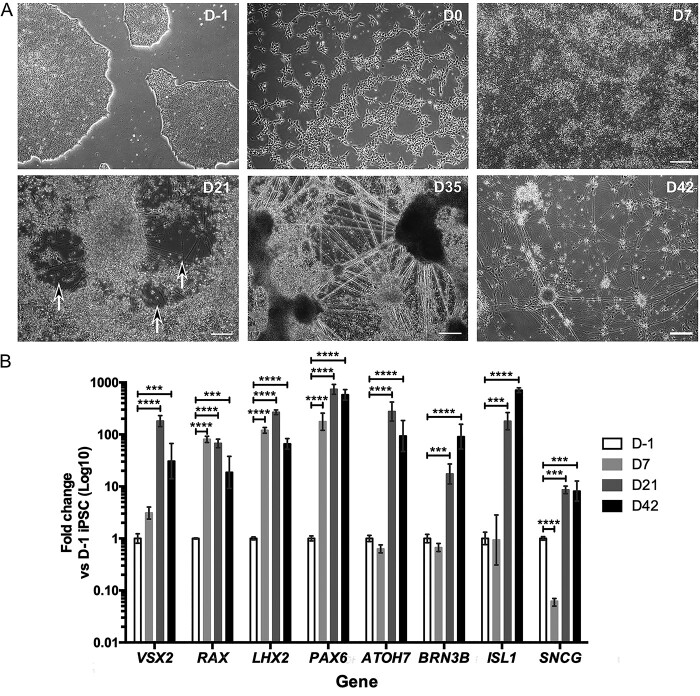
In vitro differentiation of iPSC-RGCs. (A) Representative phase contrast images of iPSC-RGC differentiation showing cellular morphology at distinct time points during retinal differentiation. D21, black arrows highlight regions with axonal projections. Scale bars = 250 μm. (B) Temporal gene expression during iPSC-RGC differentiation at day (D) D-1, D7, D21 and D42 of control RGC differentiation cultures to determine expression of key RGC genes involved in early development (VSX2, RAX, LHX2, PAX6), the specification of RGCs (ATOH7) and terminal RGC differentiation (ISL1, BRN3B, SNCG). Gene expression was first normalized to the geometric mean of GAPDH and ACTIN, and then normalized to D-1 undifferentiated iPSC. Bars represent mean expression ± SEM. n = 3–4 RNA samples per time point from 3–4 independent differentiations. ***P < 0.001, ****P < 0.0001.

