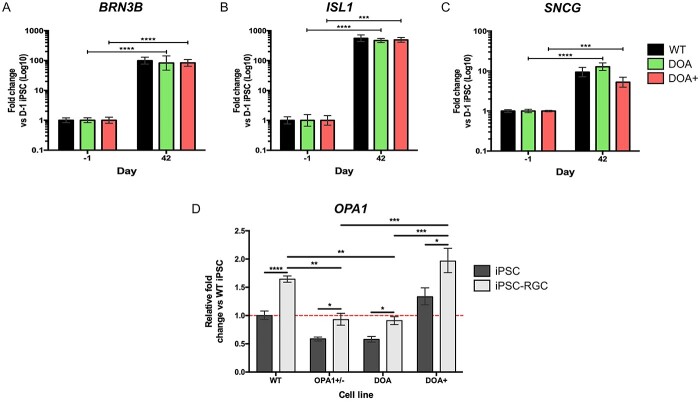
Figure 4.
Characterization of in vitro iPSC-RGCs generated from DOA patient-derived iPSC. (A–C) Temporal qPCR analysis of key RGC transcription factors BRN3B (A), ISL1 (B) and SNCG (C) at D-1, D7, D21 and D42 in WT control, DOA and DOA+ iPSC differentiations. DOA and DOA+ iPSC demonstrated no significant impairment in terminal RGC gene expression when compare to WT iPSC. Gene expression was first normalized to the geometric mean of GAPDH and ACTIN expression, and then normalized to D-1 undifferentiated iPSC to determine fold change. Bars represent mean expression ± SEM. n = 3–4 RNA samples per time point from 3–4 independent differentiations. ***P < 0.001, ****P < 0.0001. (D) Quantification of total OPA1 expression in OPA1+/−, DOA and DOA+ iPSC-RGCs via qPCR. All cell lines demonstrate significant upregulation of OPA1 in iPSC-RGC cultures when compared to naïve D-1 iPSC. OPA1+/− and DOA iPSC-RGCs demonstrate significantly reduced OPA1 expression compared to WT iPSC-RGCs. OPA1 expression was first normalized to the geometric mean of GAPDH and ACTIN expression, and then normalized to D-1 undifferentiated WT iPSC to determine fold change. Bars represent mean expression ± SEM. n = 3–4 RNA samples per time point from 3–4 independent differentiations. *P < 0.05, **P < 0.01, ***P < 0.001 ****P < 0.0001.

