Figure 3.
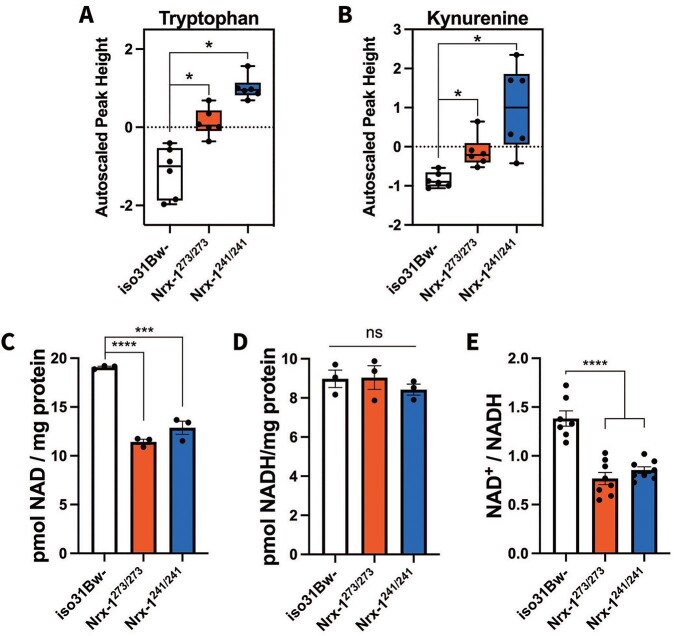
Nrx-1 mutants exhibit altered tryptophan, kynurenine and NAD+ levels. Quantification of (A) tryptophan and (B) kynurenine by GC/TOF-MS in Nrx-1 mutants and iso31Bw- controls. Six samples of 40 flies for each genotype were used for the analysis. Box plots depict the autoscaled peak height of metabolites on the y-axis. Mann–Whitney U test revealed that both Nrx-1273/273 (P = 0.021421) and Nrx-1241/241 (P = 0.019413) flies exhibit elevated tryptophan levels. Similarly for kynurenine, Nrx-1273/273 (P = 0.021421) and Nrx-1241/241 (P = 0.019413) flies showed increased kynurenine levels compared to wild-type flies. Additionally, Mann–Whitney U test indicated no significant difference in tryptophan or kynurenine levels between Nrx-1273/273 and Nrx-1241/241 flies. Quantification of (C) NAD+, (D) NADH and the (E) NAD+/NADH ratio in Nrx-1 mutants and wild-type flies. The levels of NAD+ and NADH were normalized to protein content. Each data point represents an independent sample of 10 fly bodies. One-way ANOVA followed by Tukey–HSD post-hoc test indicated that compared to iso31Bw- controls, NAD+ levels were significantly decreased in both Nrx-1273/273 (P < 0.0001) and Nrx-1241/241 (P = 0.0001) flies. NADH levels were not significantly different than controls. The NAD+/NADH ratio was significantly diminished in both Nrx-1273/273 and Nrx-1241/241 flies (P < 0.0001). These experiments were performed three independent times. The NAD+ and NADH values shown (C and D) are representative figures from one experiment. The NAD+/NADH ratio is internally normalized, allowing data to be pooled from all three independent experiments. Sample number (N) per genotype for NAD+ and NADH data = 3. Sample number (N) per genotype for NAD+/NADH ratio data: iso31Bw- N = 7, Nrx-1273/273 N = 8, Nrx-1241/241 N = 8. Values represent mean ± SEM.

