Figure 4.
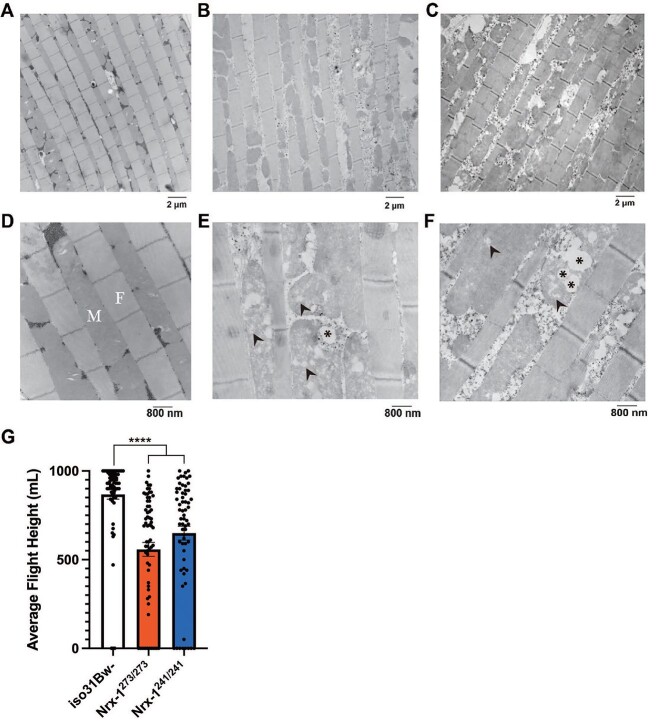
Loss of Nrx-1 leads to abnormal mitochondrial morphology and impaired flight. Longitudinal sections of indirect flight muscle of iso31Bw- flies (A and D), Nrx-1273/273 flies (B and E) and Nrx-1241/241 flies (C and F) were prepared from isolated thoraces for transmission electron microscopy experiments. (A–C) Electron micrographs of Drosophila flight muscle at 7500X magnification. Scale bar indicates 2 microns. (D–F) Electron micrographs of Drosophila flight muscle at 20 000X magnification. Scale bar indicates 800 nm. Images show mitochondria (M) aligned between rows of myofibrils (F), where Nrx-1 mutants have irregularly spaced mitochondria with marked disruptions in the cristae. Arrowheads denote disruptions in cristae. Asterisks signify areas devoid of cristae. (G) Quantification of the average landing height for flies of each genotype in a glycerol flight assay. Each data point represents an individual fly. Kruskal–Wallis test with Dunn’s multiple comparisons post-hoc test showed that Nrx-1273/273 and Nrx-1241/241 flies performed significantly worse on a glycerol flight assay compared to control flies. Sample number (N) per genotype: iso31Bw- N = 66, Nrx-1273/273 N = 67, Nrx-1241/241 N = 63. Values represent mean ± SEM. **** = P < 0.0001.

