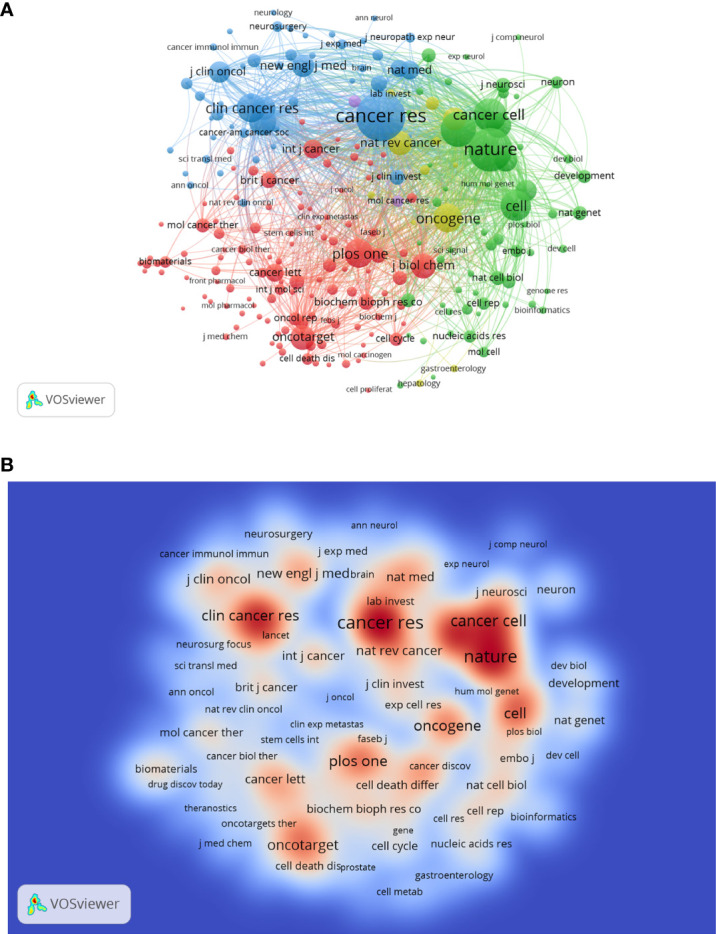
Figure 6.

The network visualization map (A) and density visualization map (B) of journal co-citation analysis. In the visualization map, each node represents a journal and its size is proportional to the number of publications. The deeper the color of a node, the more frequently of keywords appears.
